
The Inflation Reduction Act (IRA) makes the largest investment in clean energy workers and projects in U.S. history. The IRA includes enhanced tax incentives for taxpayers that pay workers prevailing wages and use registered apprentices for the construction, and in some cases the alteration or repair, of qualified clean energy facilities, property, projects, or equipment.
The U.S. Department of Labor is collaborating with agencies across the federal government to help ensure that climate investments create good-paying jobs. The IRA's unparalleled investments to secure our clean energy future and the federal government's implementation of these requirements will incentivize employers to adopt worker-centric practices and support high-quality training opportunities for these good jobs.
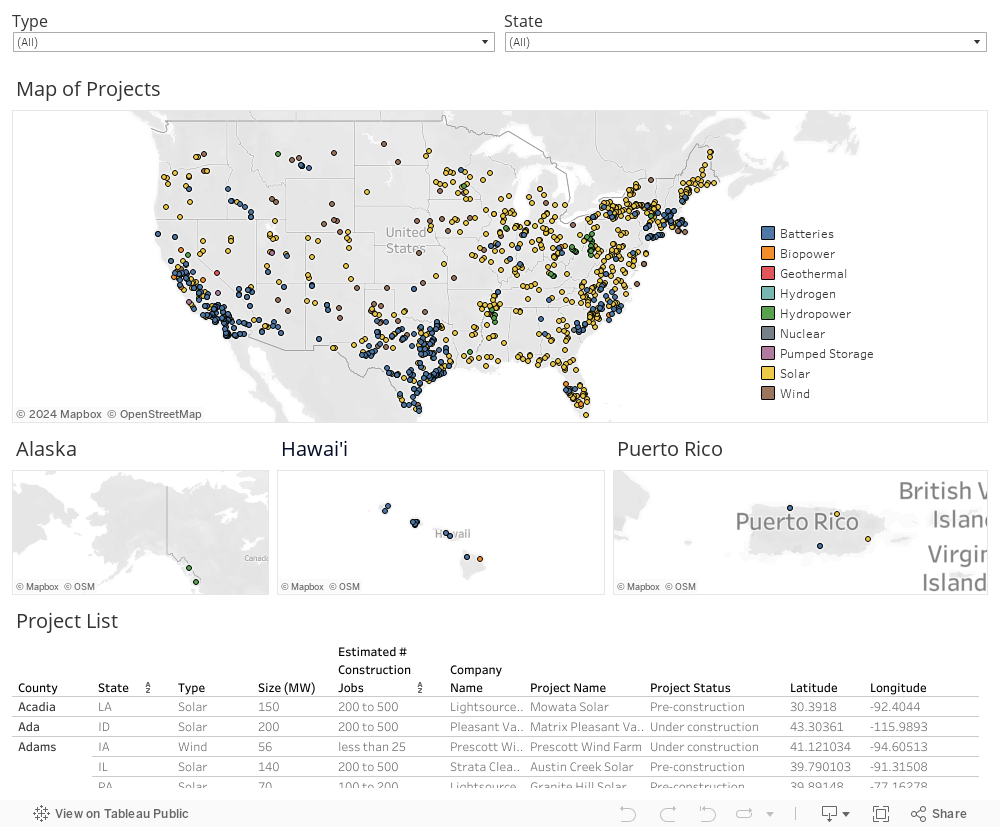
Check out the interactive map below, which shows clean energy projects across the country that could potentially be eligible for the IRA's enhanced tax incentives if taxpayers satisfy the IRA's prevailing wage and registered apprenticeship provisions, as well as other applicable IRA requirements. This map is based on publicly available data from the Energy Information Administration about planned clean energy projects. The information provided in this map does not indicate eligibility for federal tax incentives and does not constitute federal taxpayer information.
The map includes clean energy projects that are under construction or in a pre-construction phase, sortable by sector and state. For each project, the map and the following downloadable spreadsheet identify the project location, sector, size, company, name, status, and estimated number of construction jobs. For a broader snapshot of clean energy projects announced since the President took office—and other investments catalyzed by his Investing in America agenda—visit invest.gov.
More Information
- Internal Revenue Service Resources on the IRA Prevailing Wage and Apprenticeship Requirements
- U.S. Department of the Treasury Overview of Prevailing Wage and Apprenticeship Requirements.
- Department of Labor Overview of Prevailing Wage and the IRA
- Department of Labor Overview of Apprenticeships and the IRA
- Department of Labor Overview of Project Labor Agreements and the IRA
Notice
- This content provides an overview of certain IRA tax provisions based on tax guidance and other information on IRS.gov. This content is for general informational purposes only and is not itself tax guidance.
- Please refer to guidance issued by the U.S. Department of the Treasury and the Internal Revenue Service for detailed information on the rules associated with IRA tax provisions.
Sources and Methodology
- Planned clean energy project information comes from U.S. Energy Information Administration Form 860M (as of April 16, 2024).
- Construction job estimates represent projected labor demand of each project. The estimates are based on construction employment multipliers for each technology type from the publicly available Dartmouth DEERS and NREL JEDI models, accounting for average construction timelines from NREL.1
Accessibility
The U.S. Department of Labor (DOL) is committed to providing access to all individuals who are seeking information from the clean energy projects map and to comply with Section 508 of the Rehabilitation Act of 1973, as amended. Section 508 requires that all individuals with disabilities (whether they are federal government employees or members of the general public) have access to, and use of information and data, comparable to that provided to individuals without disabilities, unless an undue burden would be imposed on DOL.
Any individual with a disability who has difficulty accessing documents and materials related to the clean energy projects map should contact U.S. DOL staff at GoodJobsInitiative@dol.gov.
This request should include:
- reference to the clean energy projects map,
- nature of the accessibility problem encountered,
- specific information sought, and
- contact email address or phone number for a response.
U.S. DOL staff will respond promptly and work to provide the information being sought.
1 The number of construction jobs for each project is estimated by multiplying the nameplate capacity for each individual project by the average construction labor demand for that particular technology, and dividing by the average construction period. For example, 100 MW of solar multiplied by 6,468 job-years/GW of solar installed, divided by 3 years for construction of a solar project is approximately 215 jobs. Job estimates are shown as ranges (e.g., 200-500 jobs) to reflect uncertainty in the estimates and variability in project requirements.