
WIOA by the Numbers: Data Analysis Tools
States collect and report key data about who is served under the Workforce Innovation and Opportunity Act (WIOA) and their outcomes. The Employment and Training Administration (ETA) invites the public and workforce system stakeholders to explore the performance accountability data for Titles I and III.
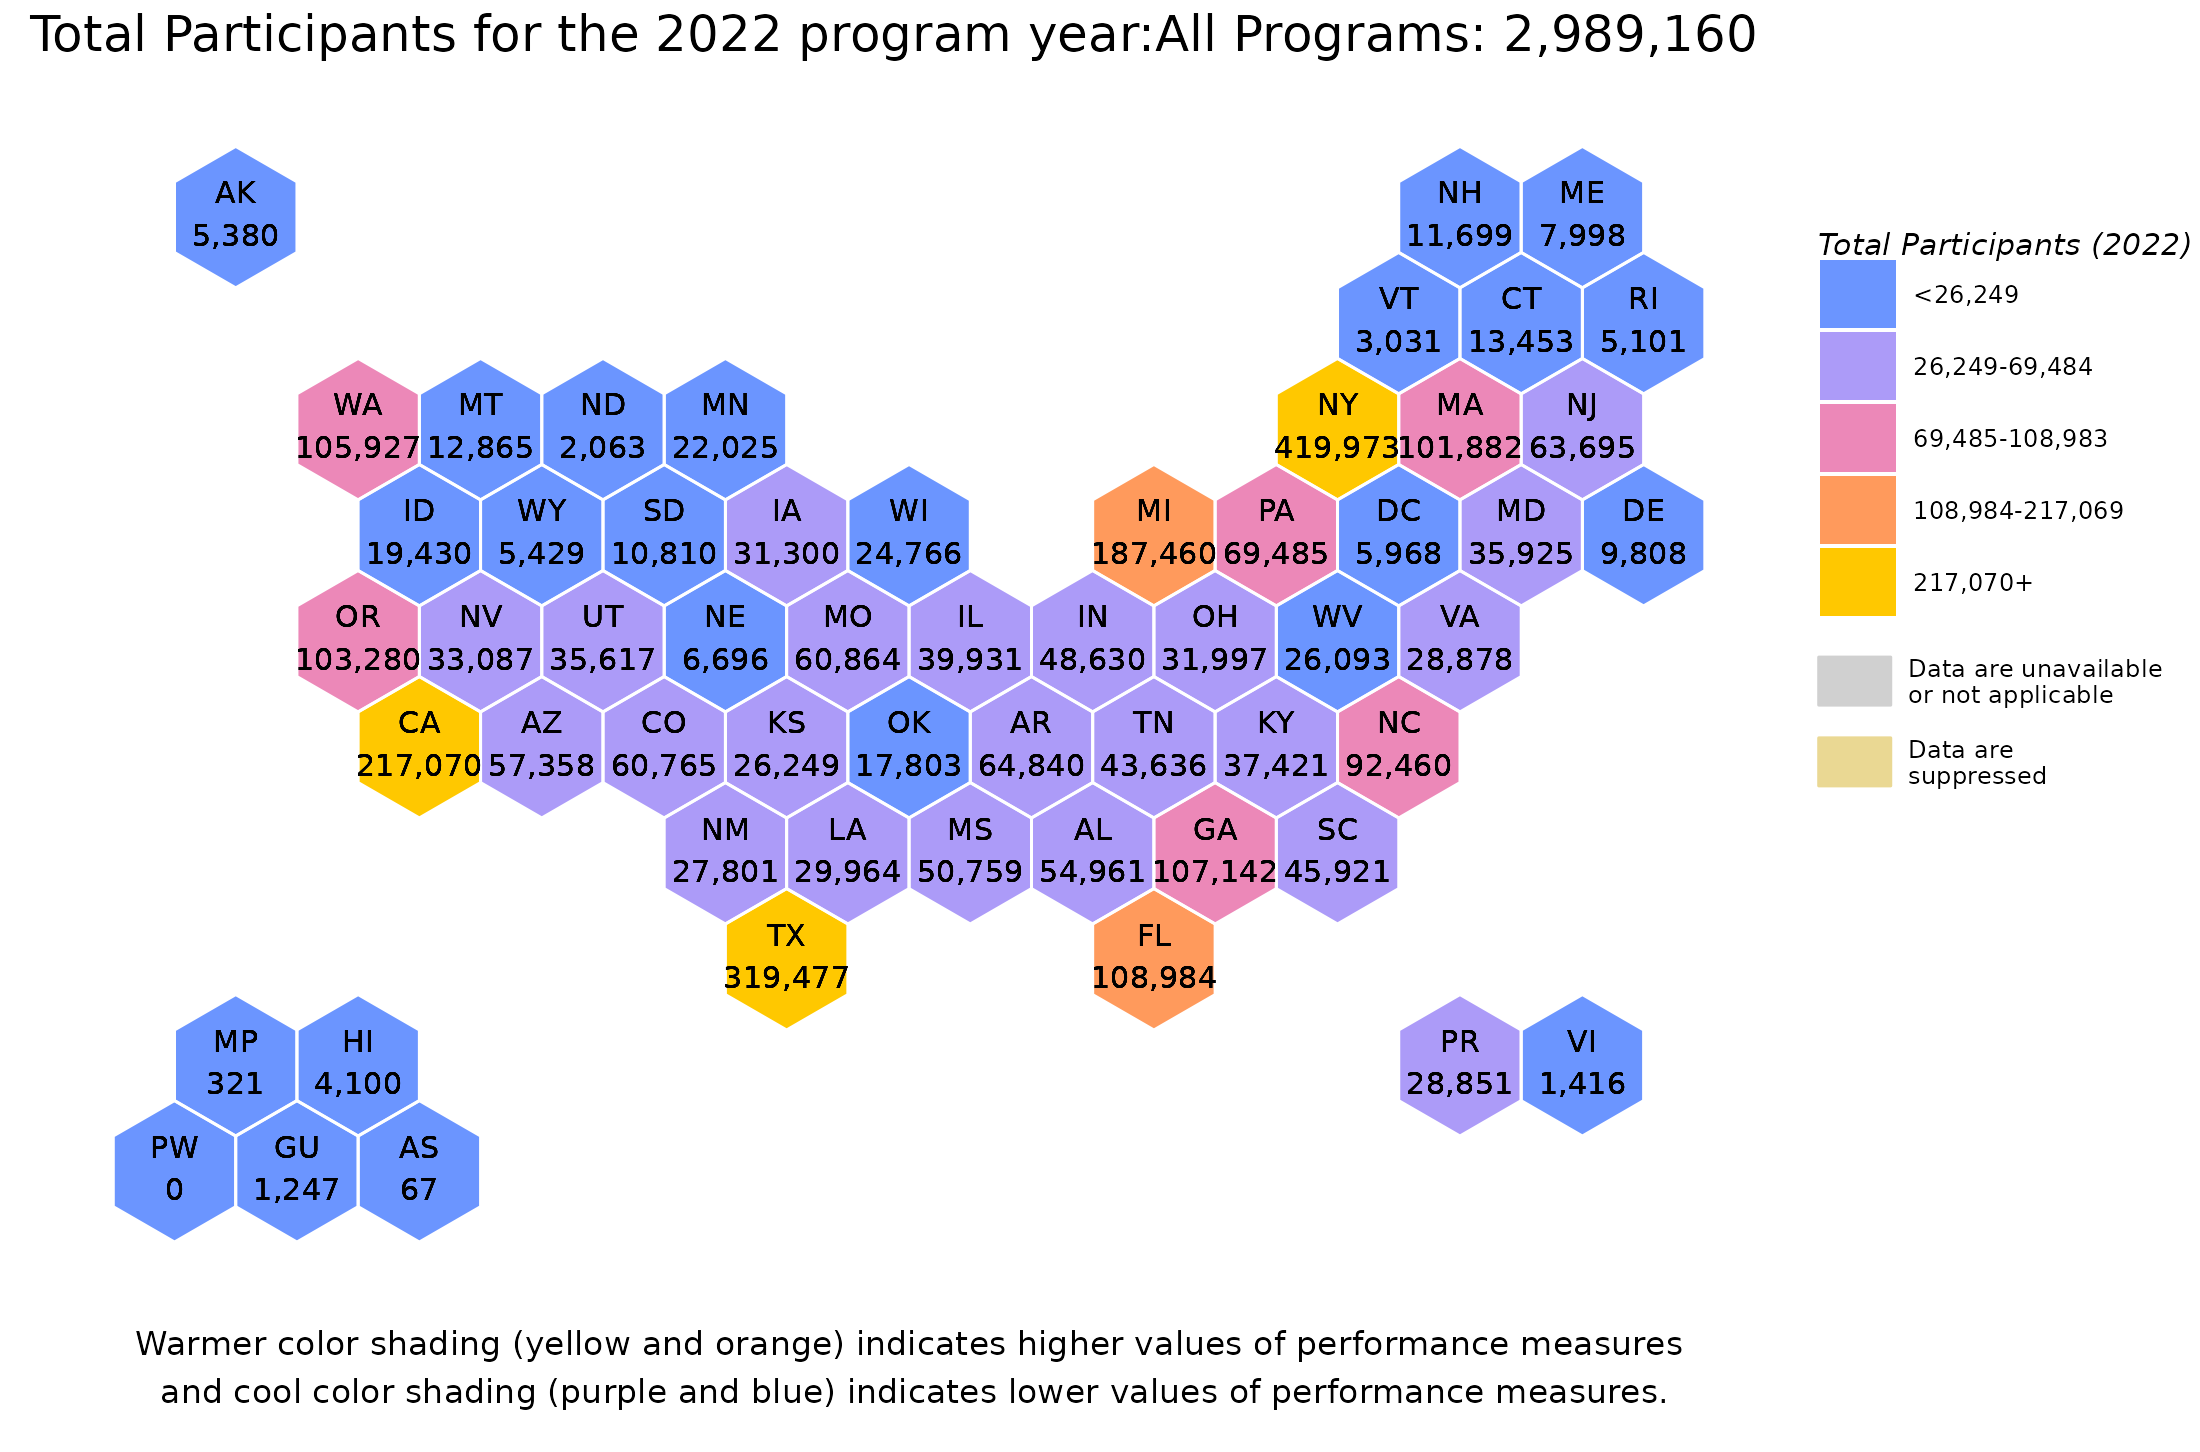
Use these dynamic tools to better understand workforce system outcomes, including Data by Map, State Comparisons, and Data by Tables. Check out national and state trends, filter and customize state comparisons, and download your analyses.
Participants and Outcomes
Explore national and state trends, filter and customize state comparisons, and download your analyses.
Participant Characteristics and Outcomes
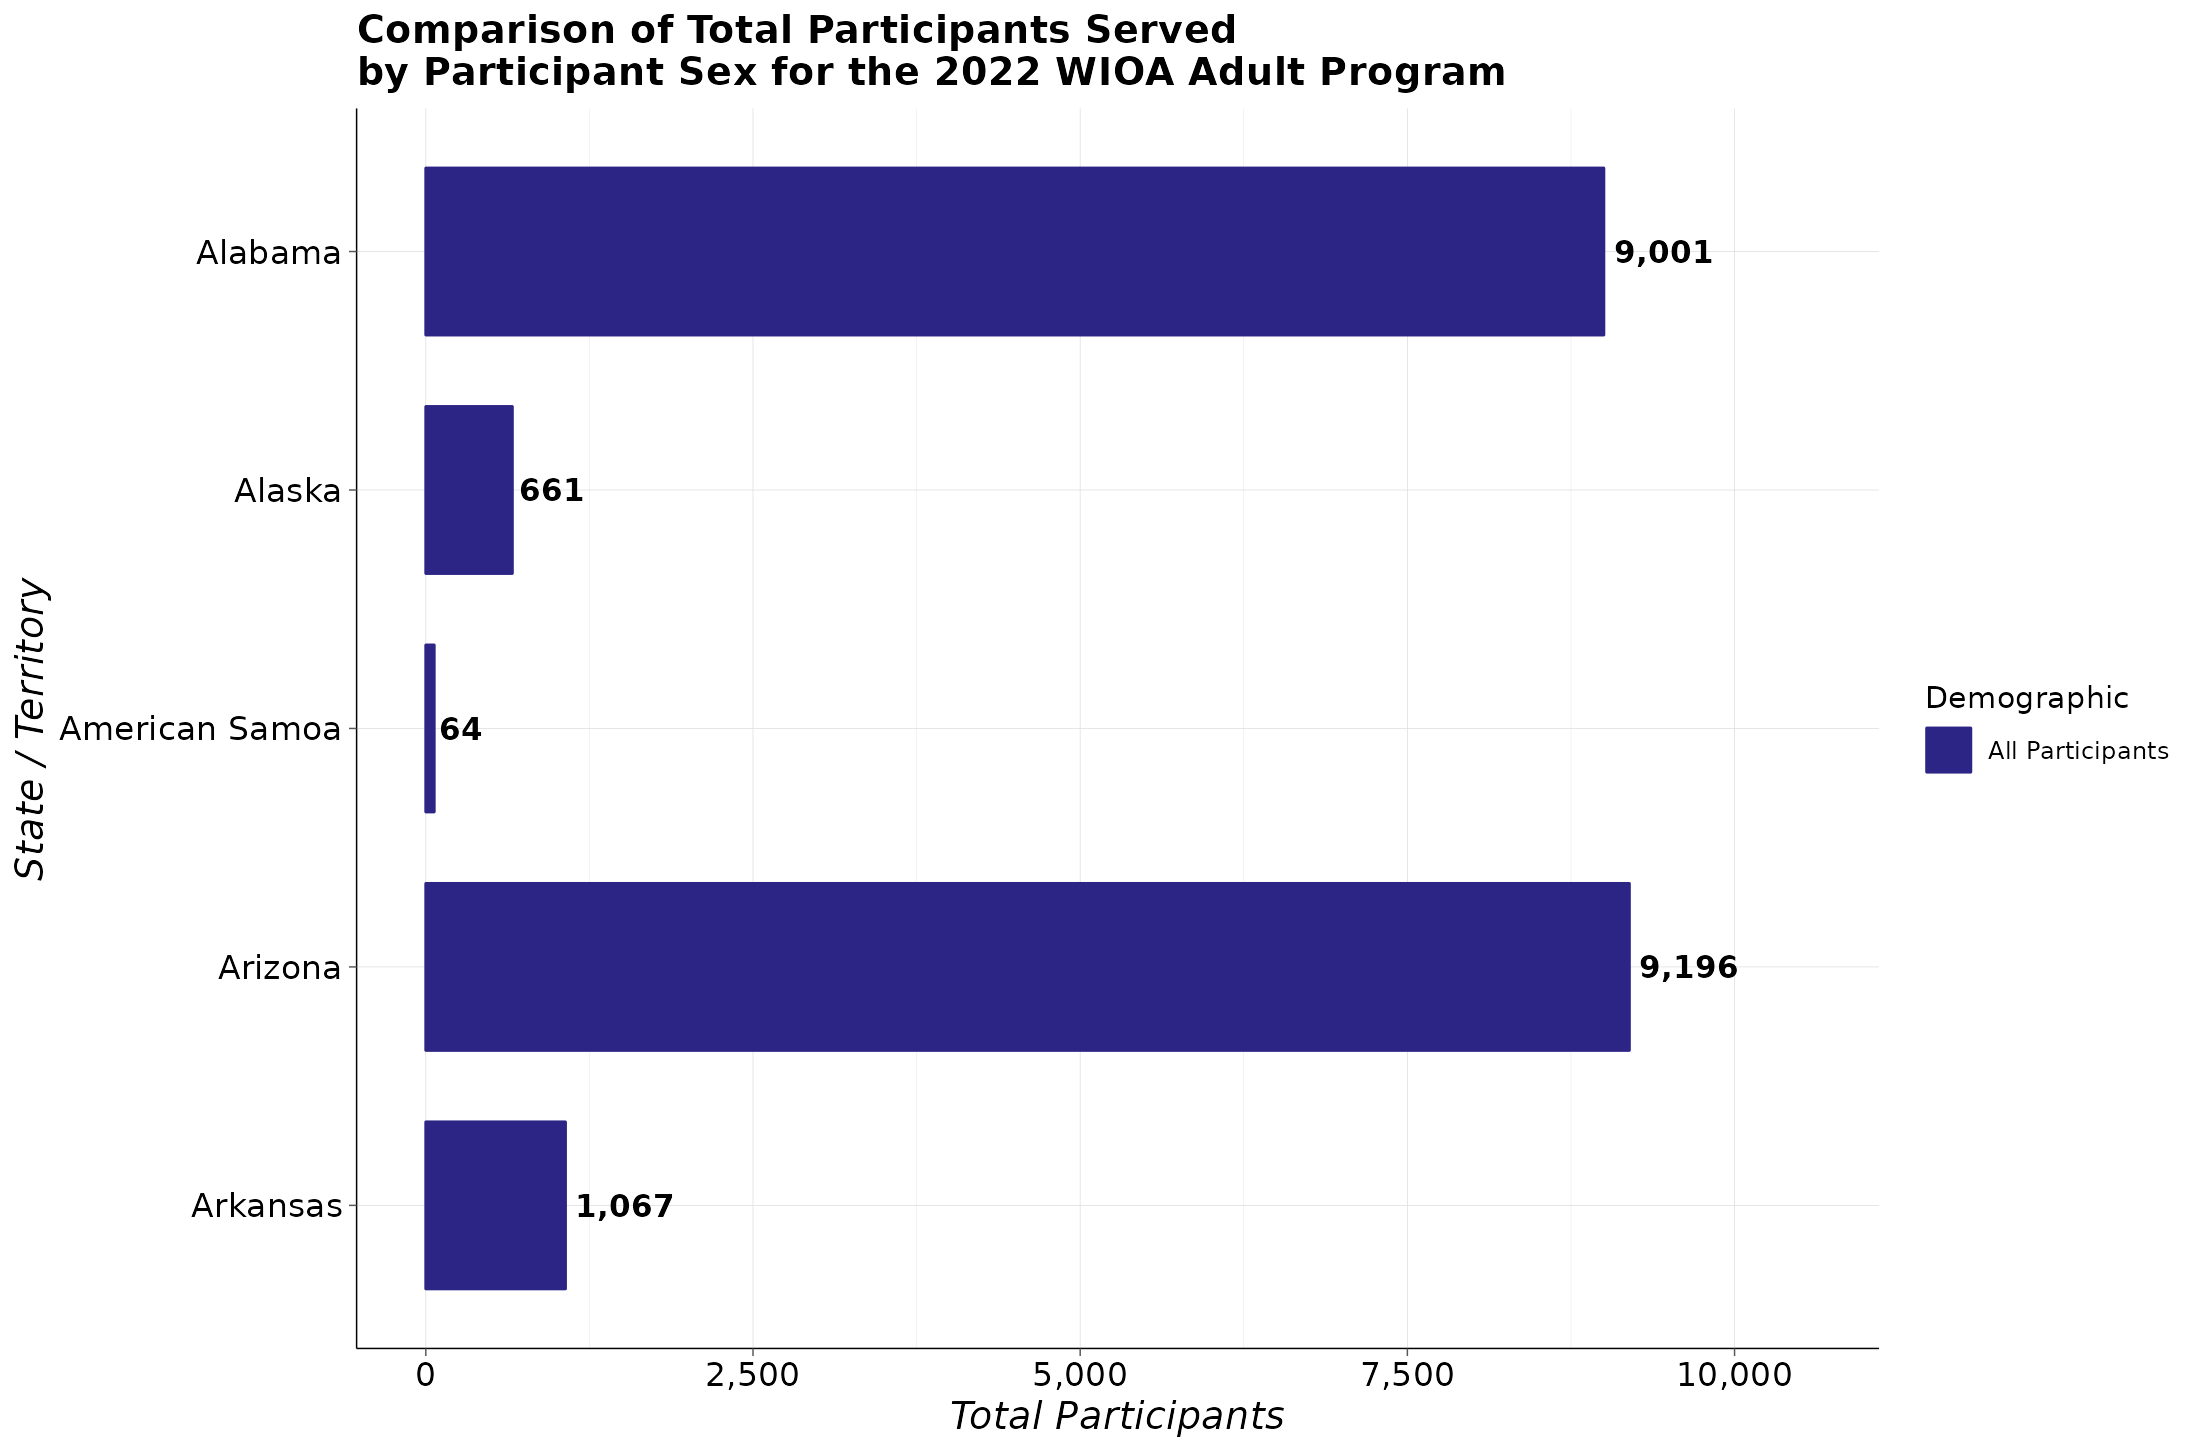
Explore differences in performance outcomes on the state and national levels, across different programs and program years, as well as by different participant characteristics.

Explore differences in training and services received on the state and national levels, across different programs and program years, as well as by different participant characteristics.
.png)
Explore participation and exit levels at the state and national levels, across different programs and program years, as well as by participant's demographic characteristics.