Registered Apprenticeship National Results
Fiscal Year (FY) 2015 (10/01/2014 to 9/30/2015)
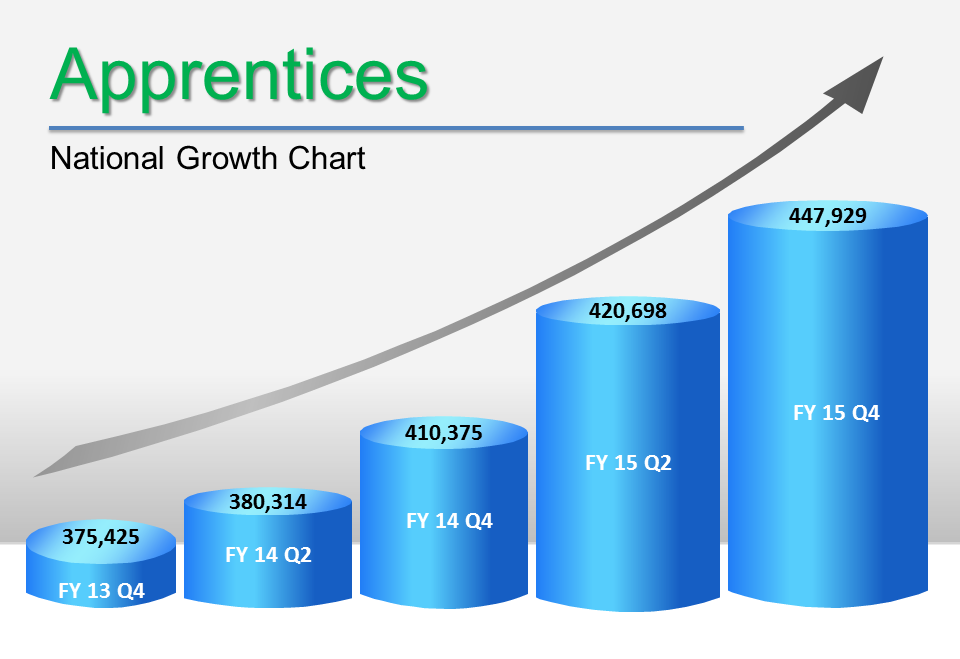
An individual employer, group of employers, or an industry association can sponsor a Registered Apprenticeship program, sometimes in partnership with a labor organization. Registered Apprenticeship program sponsors make significant investments to design and execute apprenticeship programs, provide jobs to apprentices, oversee training development, and provide hands-on learning and technical instruction for apprentices. The programs are operated on a voluntary basis and are often supported by partnerships consisting of community-based organizations, educational institutions, the workforce system, and other stakeholders.
Registered Apprenticeship program sponsors develop a set of structured standards that include requirements for related (classroom) instruction and paid on-the-job learning with appropriate supervision. Sponsors then register their program standards and apprentices with the Office of Apprenticeship (OA) or a State Apprenticeship Agency (SAA) recognized by the Department. Through apprenticeship agreements, sponsors and apprentices agree to the requirements of the registered program. At the successful completion of the on-the-job and instructional learning, apprentices receive an industry-issued, nationally recognized portable certificate of completion.
Apprentices and Participation Trends
- In FY 2015, more than 197,500 individuals nationwide entered the apprenticeship system
- Nationwide, there are approximately 448,000 apprentices currently obtaining the skills they need to succeed while earning the wages they need to build financial security.
- In FY 2015, over 52,500 participants graduated from the apprenticeship system.
Apprenticeship Sponsors and Trends
- In FY 2015, more than 197,500 individuals nationwide entered the apprenticeship system.
- Nationwide, there are approximately 448,000 apprentices currently obtaining the skills they need to succeed while earning the wages they need to build financial security.
- In FY 2015, over 52,500 participants graduated from the apprenticeship system.
National Apprenticeship Data
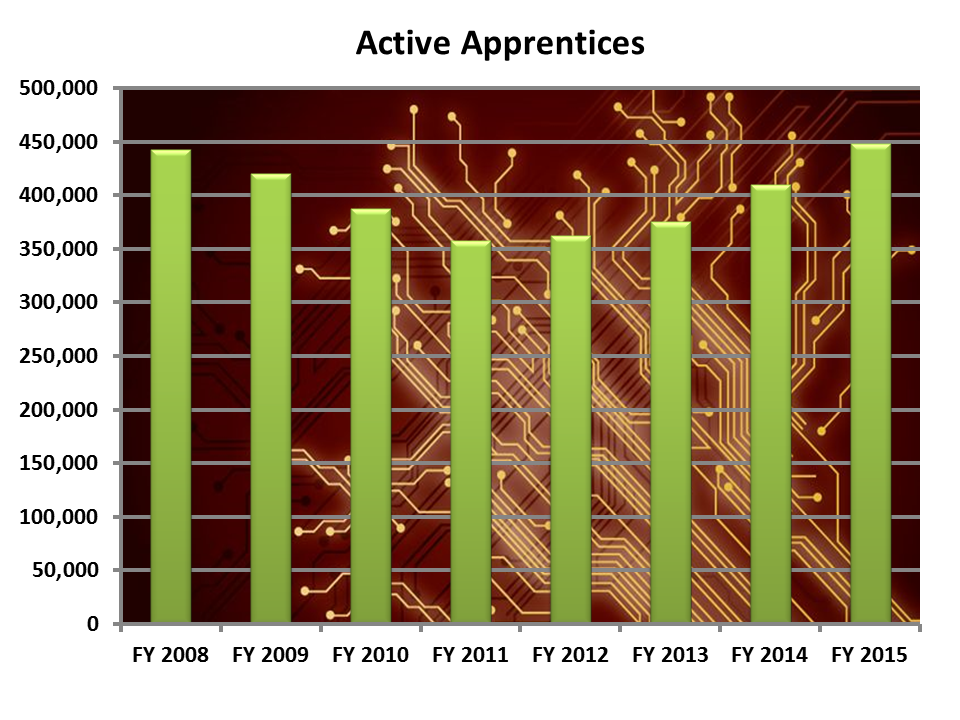
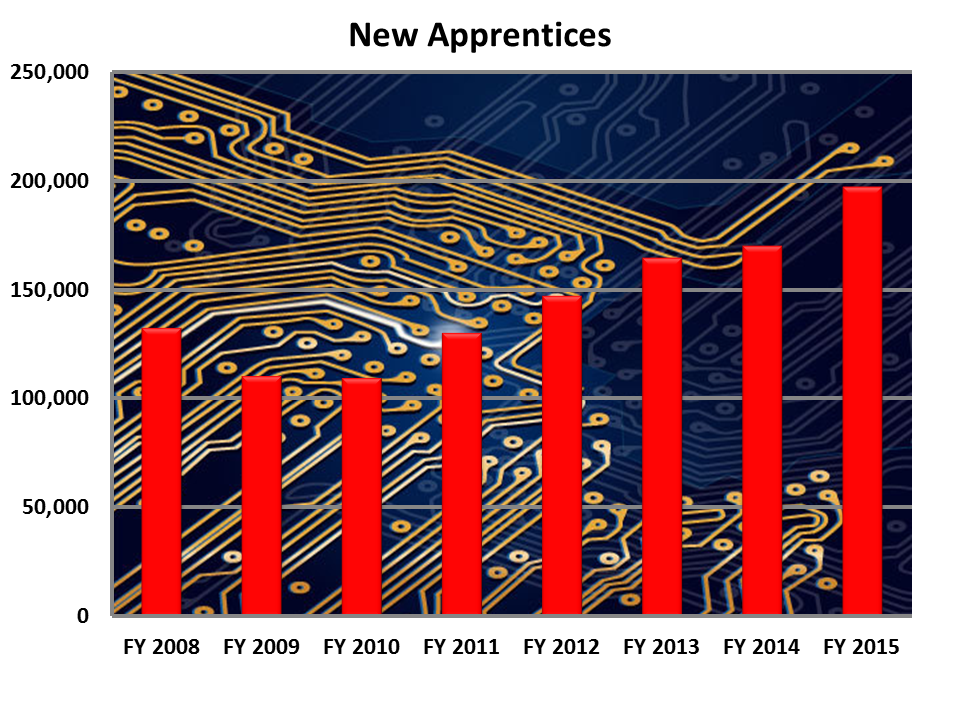
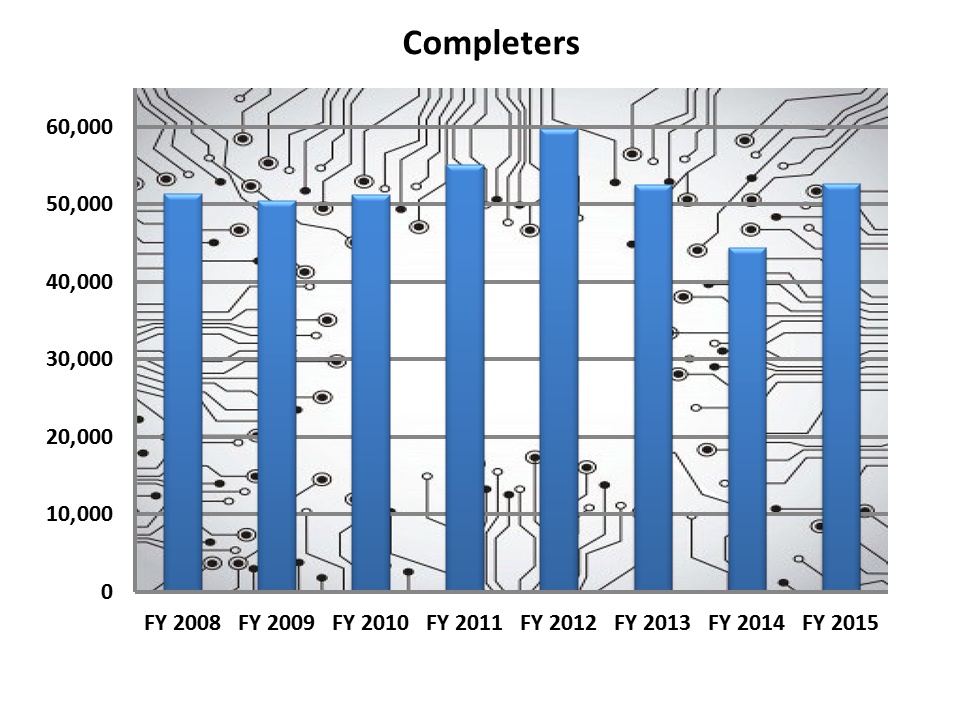
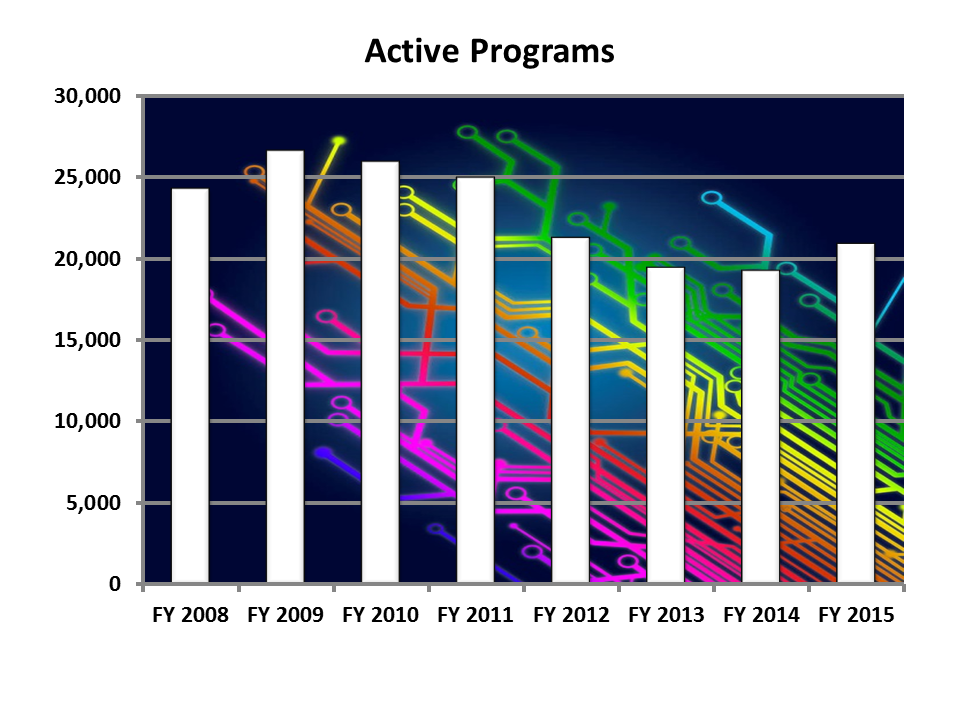
National Registered Apprenticeship Results*
| Fiscal Year | Active Apprentices | New Apprentices | Total Completers | Active Programs | New Programs |
|---|---|---|---|---|---|
|
2008 |
442,386 |
132,782 |
51,386 |
24,285 |
1,525 |
|
2009 |
420,140 |
110,707 |
50,493 |
26,622 |
1,456 |
|
2010 |
387,720 |
109,989 |
51,212 |
25,961 |
1,807 |
|
2011 |
357,692 |
130,391 |
55,178 |
24,967 |
1,409 |
|
2012 |
362,123 |
147,487 |
59,783 |
21,279 |
1,750 |
|
2013 |
375,425 |
164,746 |
52,542 |
19,431 |
1,540 |
|
2014 |
410,375 |
170,544 |
44,417 |
19,260 |
1,623 |
|
2015 |
447,929 |
197,535 |
52,717 |
20,910 |
1,898 |
* Includes the US Military Apprenticeship Program (USMAP)
United Service Military Apprenticeship Program Data
The United Services Military Apprenticeship Program (USMAP) is a formal military training program that provides active duty Navy, Coast Guard, and Marine Corps service members the opportunity to improve their job skills and to complete their civilian apprenticeship requirements while they are on active duty. The U.S. Department of Labor (DOL) provides the nationally recognized "Certificate of Completion" upon program completion.
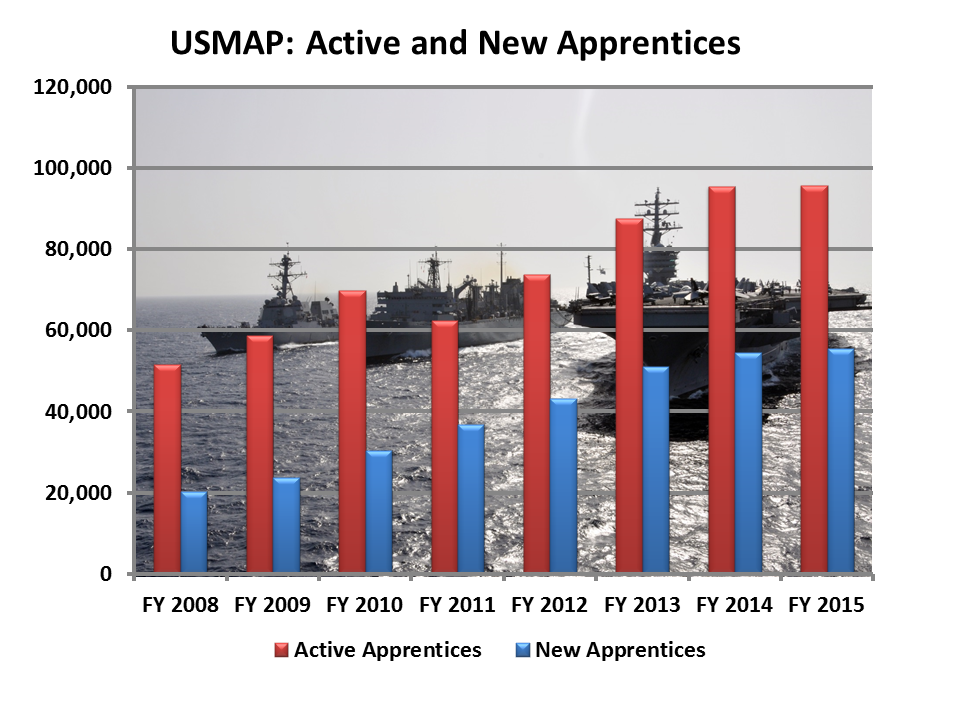
United Services Military Apprenticeship Program (USMAP)
| Item | FY 2008 | FY 2009 | FY 2010 | FY 2011 | FY 2012 | FY 2013 | FY 2014 | FY 2015 |
|---|---|---|---|---|---|---|---|---|
|
New Apprentices |
20,200 |
23,650 |
30,323 |
36,831 |
43,155 |
51,001 |
54,430 |
55,445 |
|
Active Apprentices |
51,645 |
58,652 |
69,870 |
62,404 |
73,748 |
87,675 |
95,452 |
95,770 |
|
Active Male |
44,536 |
50,133 |
58,960 |
51,459 |
60,671 |
70,690 |
76,345 |
76,173 |
|
Active Female |
7,109 |
8,519 |
10,910 |
10,945 |
13,077 |
16,985 |
19,107 |
19,597 |
|
Total Completers |
2,820 |
3,439 |
4,918 |
5,185 |
6,700 |
8,194 |
9,834 |
11,511 |
State Apprenticeship Data

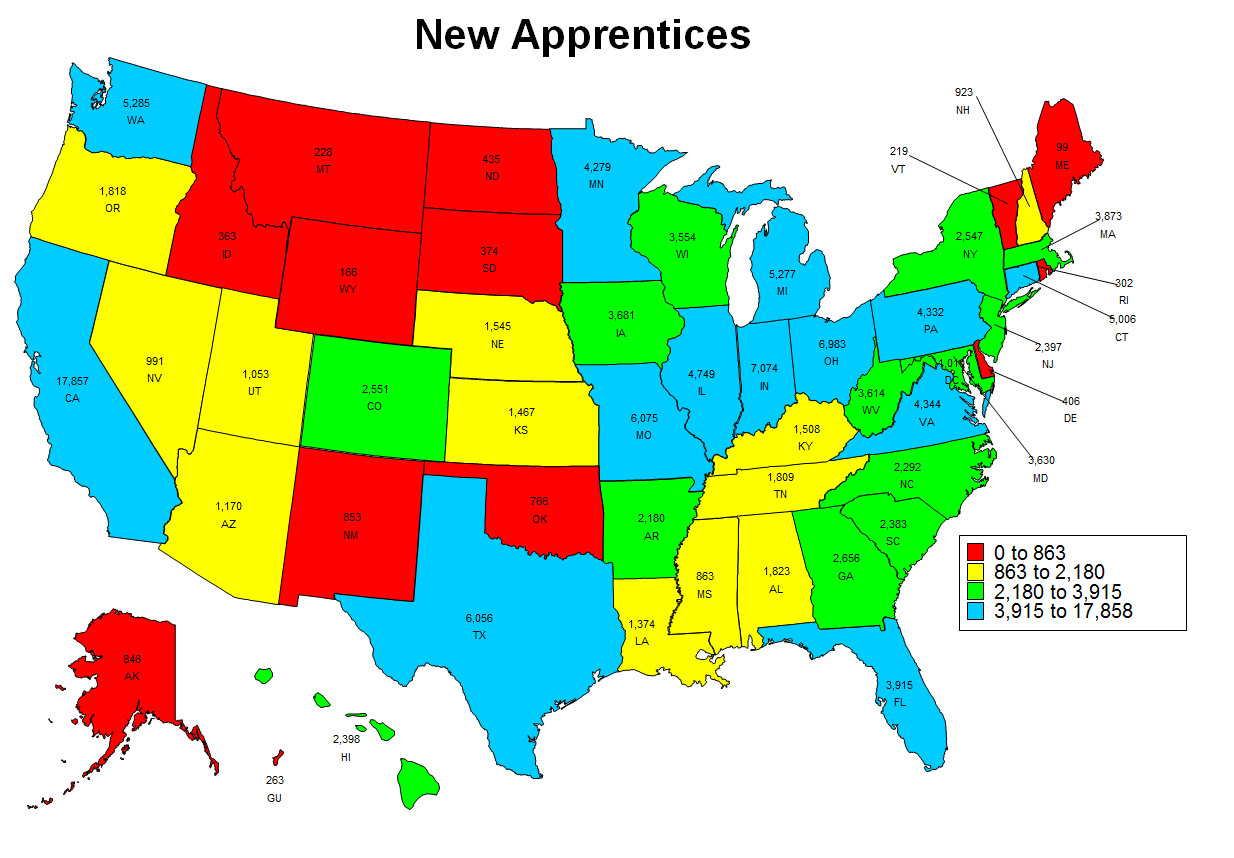
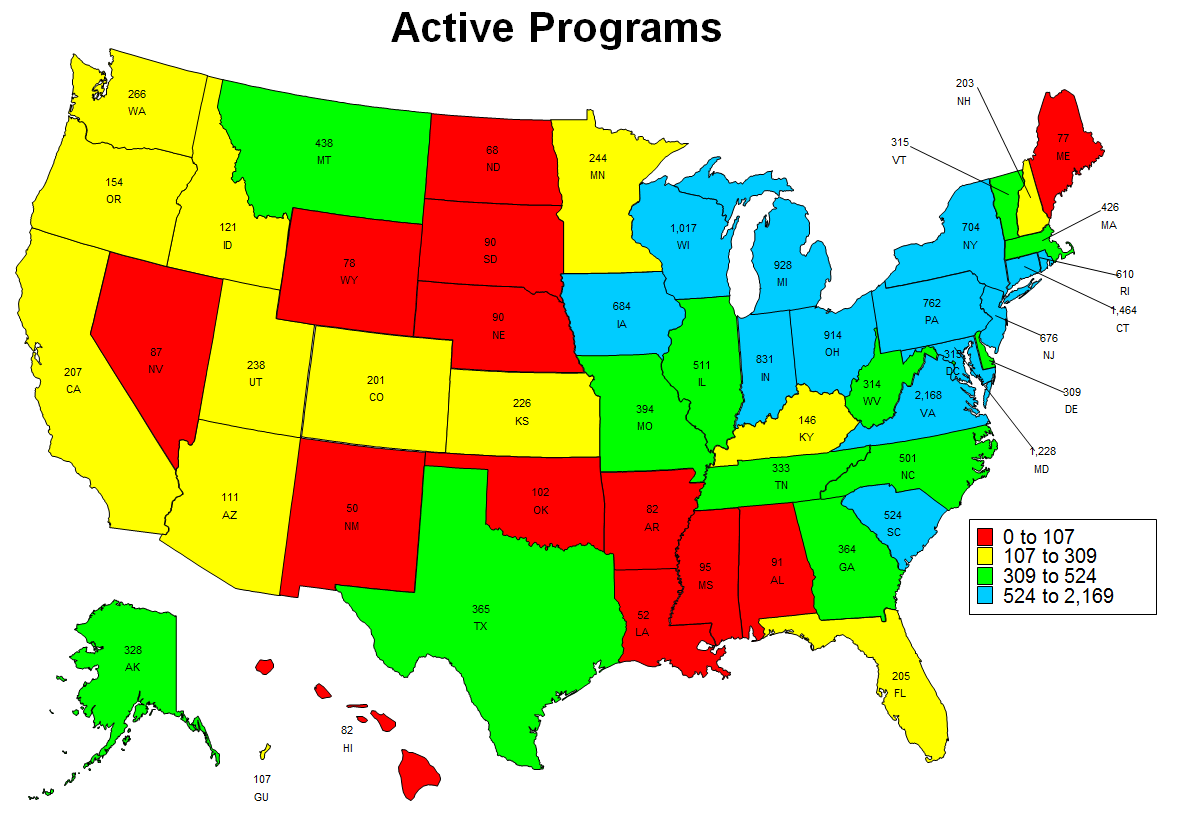
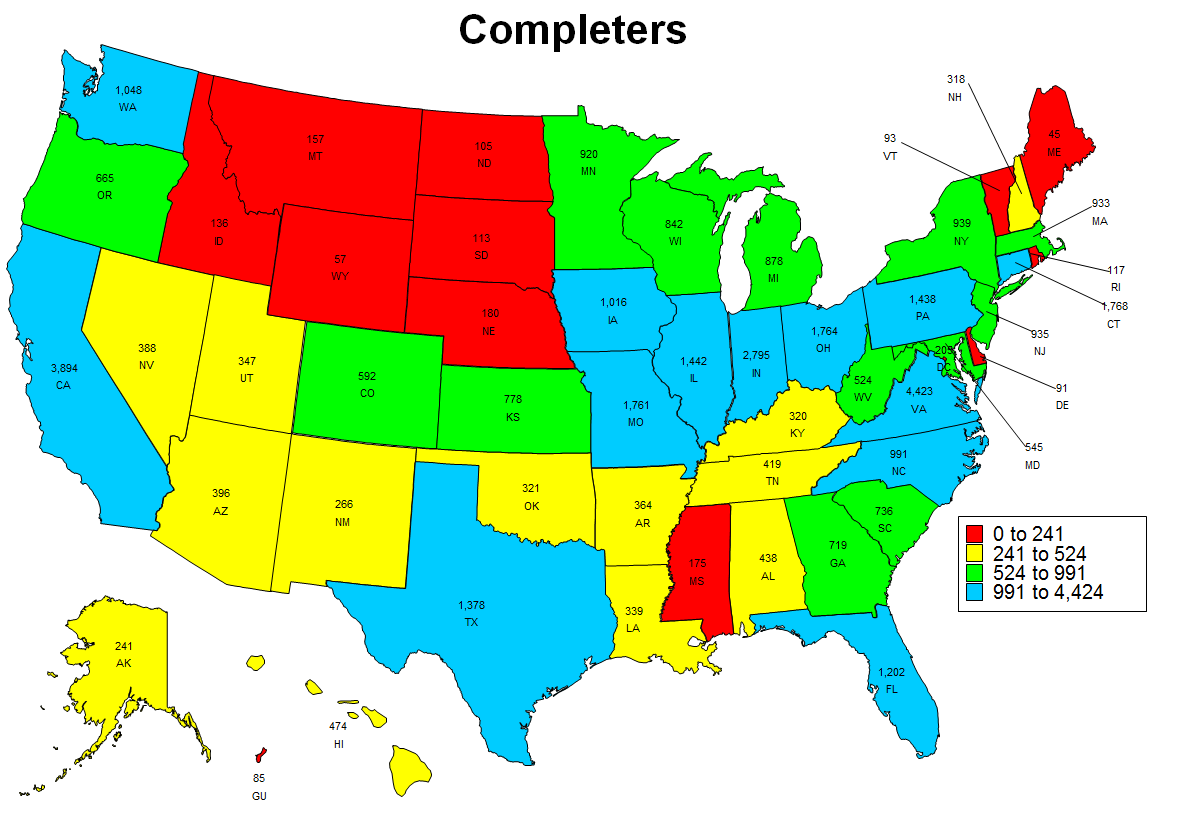
Fiscal Year 2015 State Totals
| State Name | Active Apprentice | New Apprentices | Completers | Active Programs | New Programs |
|---|---|---|---|---|---|
|
Alabama |
3,934 |
1,823 |
438 |
91 |
9 |
|
Alaska |
2,107 |
846 |
241 |
328 |
21 |
|
Arizona |
2,612 |
1,170 |
396 |
111 |
12 |
|
Arkansas |
3,775 |
2,180 |
364 |
82 |
3 |
|
California |
40,647 |
17,857 |
3,894 |
207 |
13 |
|
Colorado |
4,923 |
2,551 |
592 |
201 |
7 |
|
Connecticut |
5,611 |
5,006 |
1,768 |
1,464 |
NA |
|
Delaware |
1,188 |
406 |
91 |
309 |
36 |
|
District of Colombia |
6,936 |
1,010 |
205 |
315 |
NA |
|
Florida |
7,883 |
3,915 |
1,202 |
205 |
8 |
|
Georgia |
5,782 |
2,656 |
719 |
364 |
7 |
|
Guam |
788 |
263 |
85 |
107 |
4 |
|
Hawaii |
7,500 |
2,398 |
474 |
82 |
NA |
|
Idaho |
779 |
363 |
136 |
121 |
15 |
|
Illinois |
12,123 |
4,749 |
1,442 |
511 |
18 |
|
Indiana |
11,283 |
7,074 |
2,795 |
831 |
55 |
|
Iowa |
6,272 |
3,681 |
1,016 |
684 |
99 |
|
Kansas |
2,895 |
1,467 |
778 |
226 |
NA |
|
Kentucky |
3,152 |
1,508 |
320 |
146 |
27 |
|
Louisiana |
3,550 |
1,374 |
339 |
52 |
4 |
|
Maine |
512 |
99 |
45 |
77 |
NA |
|
Massachusetts |
11,267 |
3,873 |
933 |
426 |
NA |
|
Maryland |
9,130 |
3,630 |
545 |
1,228 |
88 |
|
Michigan |
11,775 |
5,277 |
878 |
928 |
78 |
|
Minnesota |
11,091 |
4,279 |
920 |
244 |
NA |
|
Mississippi |
1,856 |
863 |
175 |
95 |
5 |
|
Missouri |
8,645 |
6,075 |
1,761 |
394 |
29 |
|
Montana |
1,259 |
228 |
157 |
438 |
NA |
|
Nebraska |
2,265 |
1,545 |
180 |
90 |
1 |
|
Nevada |
2,135 |
991 |
388 |
87 |
NA |
|
New Hampshire |
1,753 |
923 |
318 |
203 |
14 |
|
New Jersey |
5,763 |
2,397 |
935 |
676 |
75 |
|
New Mexico |
1,808 |
853 |
266 |
50 |
2 |
|
New York |
16,727 |
2,547 |
939 |
704 |
55 |
|
North Carolina |
3,847 |
2,292 |
991 |
501 |
41 |
|
North Dakota |
1,116 |
435 |
105 |
68 |
11 |
|
Ohio |
15,748 |
6,983 |
1,764 |
914 |
16 |
|
Oklahoma |
1,672 |
766 |
321 |
102 |
3 |
|
Oregon |
7,028 |
1,818 |
665 |
154 |
NA |
|
Pennsylvania |
12,487 |
4,332 |
1,438 |
762 |
38 |
|
Rhode Island |
1,301 |
302 |
117 |
610 |
72 |
|
South Carolina |
5,367 |
2,383 |
736 |
524 |
97 |
|
South Dakota |
610 |
374 |
113 |
90 |
1 |
|
Tennessee |
5,293 |
1,809 |
419 |
333 |
14 |
|
Texas |
12,947 |
6,056 |
1,378 |
365 |
32 |
|
Utah |
2,606 |
1,053 |
347 |
238 |
6 |
|
Vermont |
952 |
219 |
93 |
315 |
283 |
|
Virginia |
17,005 |
4,344 |
4,423 |
2,168 |
327 |
|
Washington |
12,376 |
5,285 |
1,048 |
266 |
NA |
|
West Virginia |
5,846 |
3,614 |
524 |
314 |
24 |
|
Wisconsin |
9,280 |
3,554 |
842 |
1,017 |
96 |
|
Wyoming |
377 |
166 |
57 |
78 |
9 |
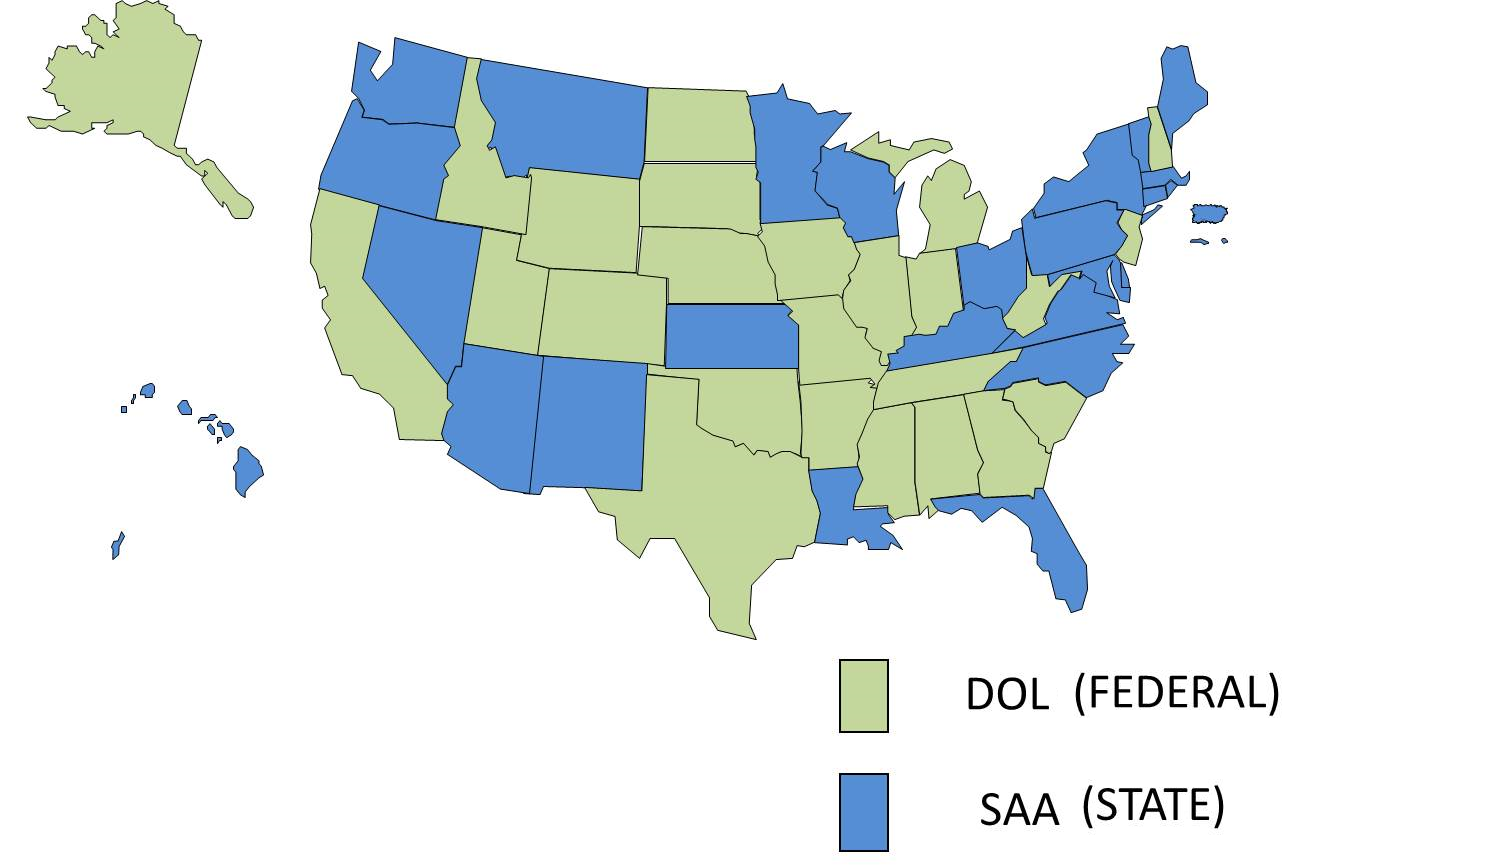
DATA NOTE: US DOL's Office of Apprenticeship uses a combination of individual records and aggregate state reports to calculate national totals as depicted on this webpage. The Registered Apprenticeship Partners Information Management Data System (RAPIDS) captures individual record data from 25 Office of Apprenticeship (OA) states and 9 of the 27 State Apprenticeship Agency (SAA) states/territories. For SAA states that manage their data outside of RAPIDS, information is provided in the aggregate to US DOL on a quarterly basis.
Federal Apprenticeship Data
The Federal data below is a summary of the data managed by Department of Labor staff in the 25 OA states and federally administered programs in SAA states.
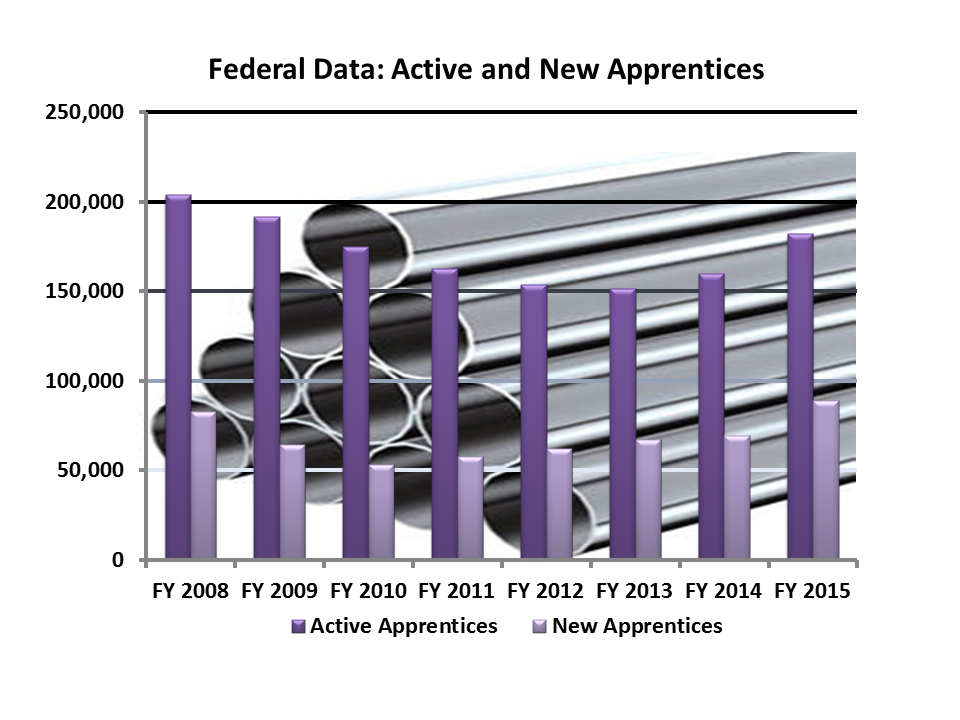
Federal Data
| Item | FY 2008 | FY 2009 | FY 2010 | FY 2011 | FY 2012 | FY 2013 | FY 2014 | FY 2015 |
|---|---|---|---|---|---|---|---|---|
| New Apprentices | 83,017 | 64,690 | 53,233 | 57,809 | 62,167 | 67,195 | 69,487 | 89,210 |
| Active Apprentices | 204,160 | 191,806 | 174,536 | 161,935 | 152,543 | 150,170 | 159,776 | 182,176 |
| New Programs | 1,145 | 1,072 | 940 | 801 | 898 | 590 | 612 | 686 |
| Active Programs | 12,146 | 11,915 | 11,404 | 10,223 | 10,166 | 9,539 | 8,828 | 8,606 |
| Program Completers | 37,466 | 29,054 | 29,393 | 29,957 | 29,284 | 26,141 | 22,380 | 23,578 |
Federal Data: Top 25 Occupations for Fiscal Year 2015
| Occupation Title | Active Apprentices |
|---|---|
|
Electrician
|
37,398 |
|
Plumbers, Pipefitters, and Steamfitters
|
21,594 |
|
Carpenter
|
16,469 |
|
Construction Laborers
|
12,603 |
|
Electrical Power-Line Installers and Repairers
|
7,154 |
|
Sheet Metal Worker
|
6,166 |
|
Structural Iron and Steel Workers |
4,939 |
|
Line Maintainer
|
3,474 |
|
Roofer
|
3,616 |
|
Drywall and Ceiling Tile Installers
|
3,509 |
|
Millwright
|
3,279 |
|
Operating Engineers and Other Construction Equipment Operators
|
3,240 |
|
Heavy and Tractor-Trailer Truck Drivers
|
2,891 |
|
Heating, Air Conditioning, and Refrigeration Mechanics and Installers
|
2,776 |
|
Boilermaker
|
2,772 |
|
Painters, Construction and Maintenance
|
2,700 |
|
Cooks, Institution and Cafeteria
|
2,273 |
|
Elevator Installers and Repairers
|
2,120 |
|
Telecommunications Equipment Installers and Repairers, Except Line Installers
|
1,914 |
|
Industrial Machinery Mechanics
|
1,804 |
|
Cement Masons and Concrete Finishers
|
1,784 |
|
Machinists
|
1,720 |
|
Telecommunications Line Installers and Repairers
|
1,687 |
|
Reinforcing Iron and Rebar Workers
|
1,653 |
|
Floor Layers, Except Carpet, Wood, and Hard Tiles
|
1,419 |
|
Insulation Workers, Floor, Ceiling, and Wall
|
1,289 |
Federal Data: Active Apprentices by Industry for Fiscal Year 2015
| Industry Title | Active Apprentices |
|---|---|
|
Construction
|
132,100 |
|
Military (USMAP)
|
95,770 |
|
Public Administration
|
14,222 |
|
Manufacturing
|
13,532 |
|
Utilities
|
7,747 |
|
Transportation
|
5,409 |
|
Health Care and Social Assistance
|
1,903 |
|
Retail Trade
|
1,772 |
|
Wholesale Trade
|
1,487 |
|
Administrative and Support and Waste Management and Remediation Services
|
889 |
|
Agriculture, Forestry, Fishing and Hunting
|
701 |
|
Other Services (except Public Administration)
|
678 |
|
Information
|
676 |
|
Accommodation and Food Services
|
336 |
|
Professional, Scientific, and Technical Services
|
229 |
|
Mining, Quarrying, and Oil and Gas Extraction
|
228 |
|
Finance and Insurance
|
228 |
|
Warehousing
|
42 |
|
Real Estate and Rental and Leasing
|
41 |
|
Arts, Entertainment, and Recreation
|
23 |
Data Definitions
New Apprentices: apprentices registered during the period (The begin date, not the registration date is used).
New Programs: programs registered during the period.
Active Apprentices: includes registered (RE), suspended (SU), and reinstated (RI) apprentices.
Active Programs: includes registered (RE) and reinstated (RI) programs.
Active Apprentices/Programs at EOP: active at the end of period (active at beginning of period + new during period - completed/cancelled during period).
Completers: apprentices that have completed during the period.
