
Registered Apprenticeship National Results Fiscal Year 2020
10/01/2019 to 9/30/2020
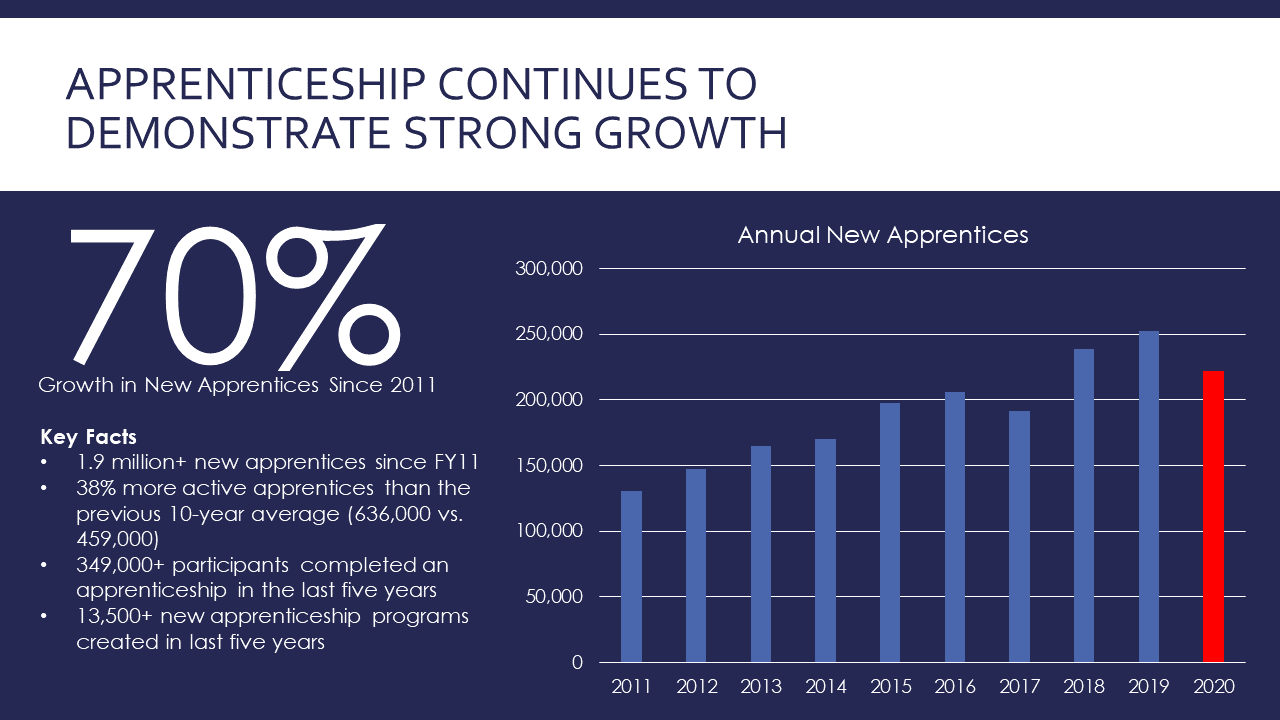
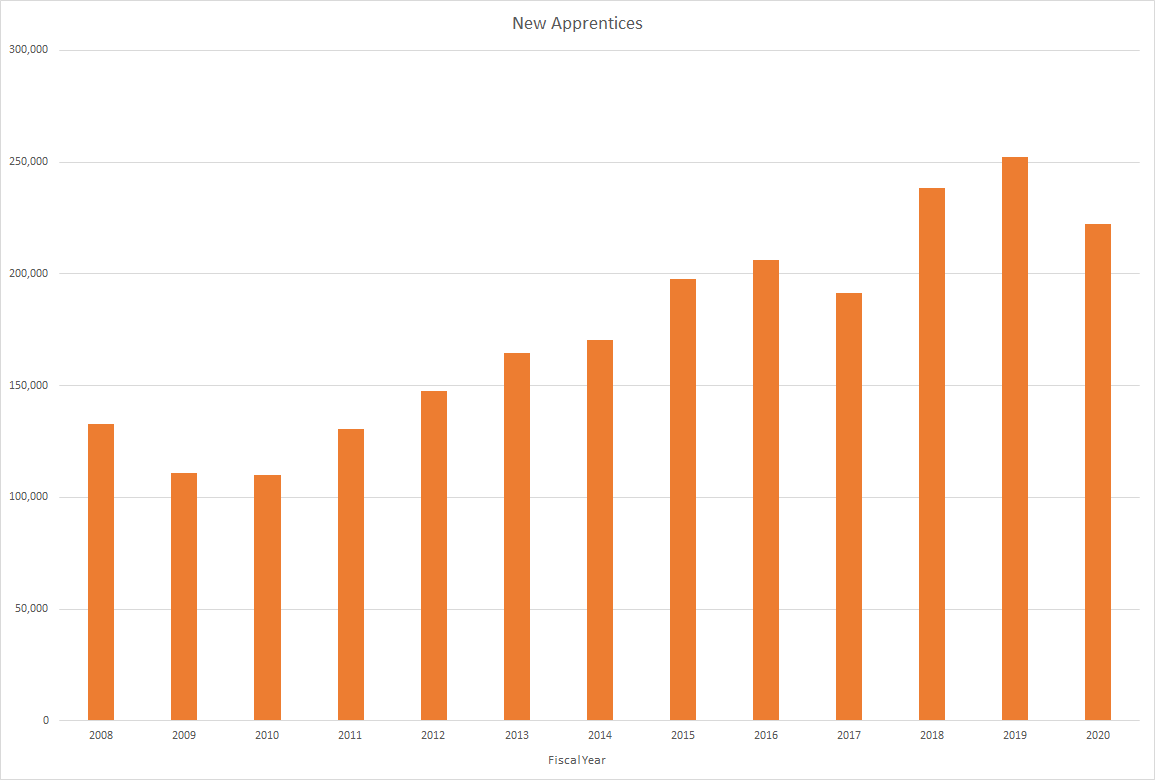
*The COVID-19 pandemic's affect on the national economy resulted in a 12% decline in the number of new apprentices in FY 2020 compared to FY 2019. Even with this decline, FY 2020 numbers are the third-highest ever for the Registered Apprenticeship program.
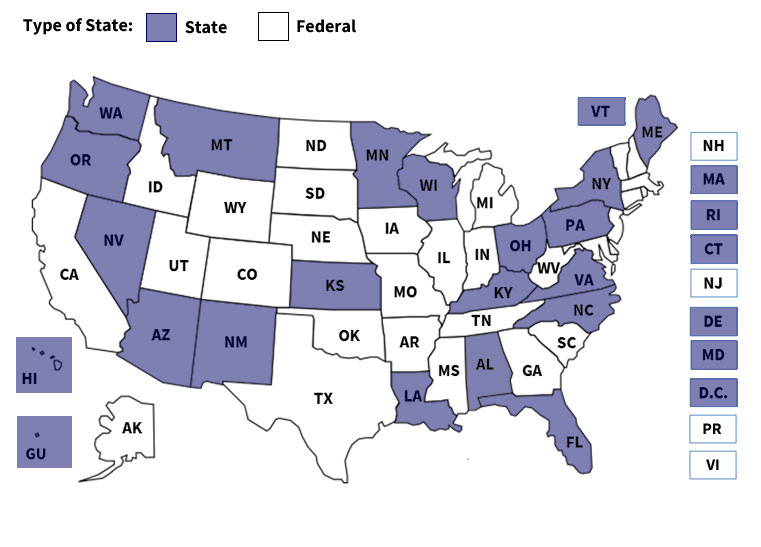
The Registered Apprenticeship data displayed on this page is derived from several different sources with differing abilities to provide disaggregated data. The 25 federally-administered states and 18 federally-recognized State Apprenticeship Agencies (SAAs) use the Employment and Training Administration's Registered Apprenticeship Partners Information Database System (RAPIDS) to provide individual apprentice and sponsor data. This subset of data is referred to as RAPIDS data and can be disaggregated to provide additional specificity. The federal subset of that data (25 states plus national programs) is known as the Federal Workload. The remaining federally recognized SAAs and the U.S. Military Apprenticeship Program (USMAP) provide limited aggregate data on a quarterly basis that is then combined with RAPIDS data to provide a national data set on high-level metrics (apprentices and programs) but cannot generally be broken out in greater detail beyond the data provided here.
Apprentices and Participation Trends
- In FY 2020, more than 221,000 individuals nationwide entered the apprenticeship system.
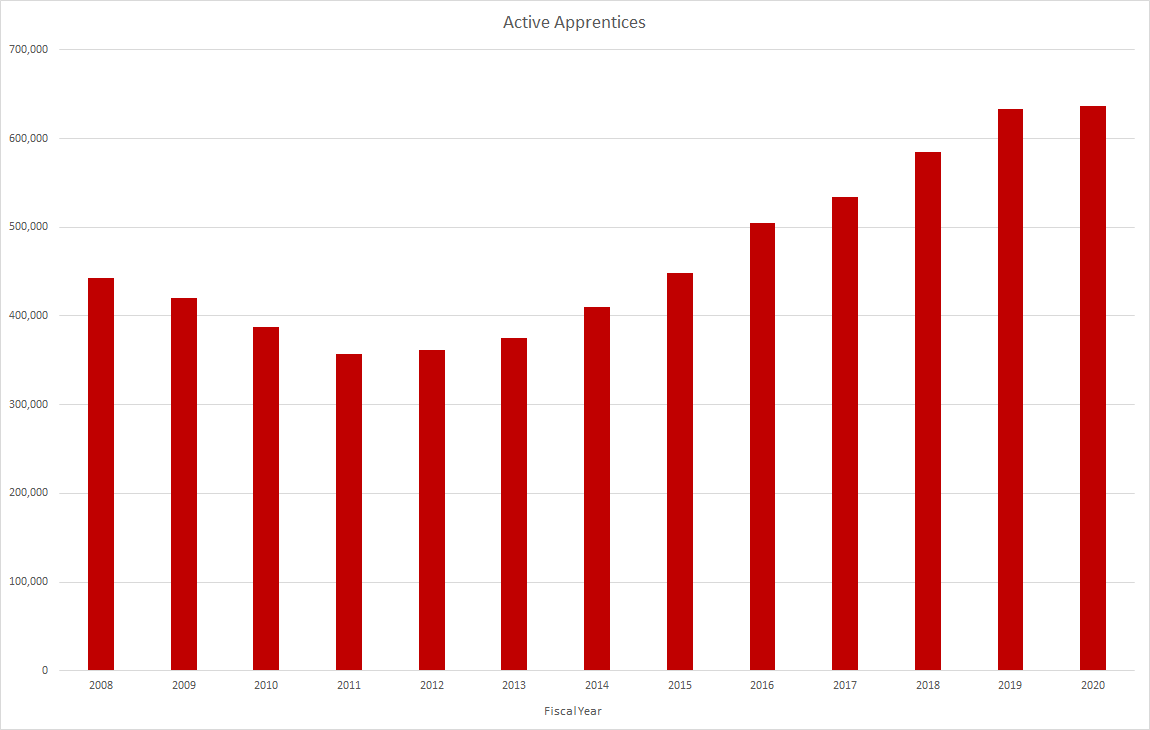
- Nationwide, there were over 636,000 apprentices obtaining the skills they need to succeed while earning the wages they need to build financial security.
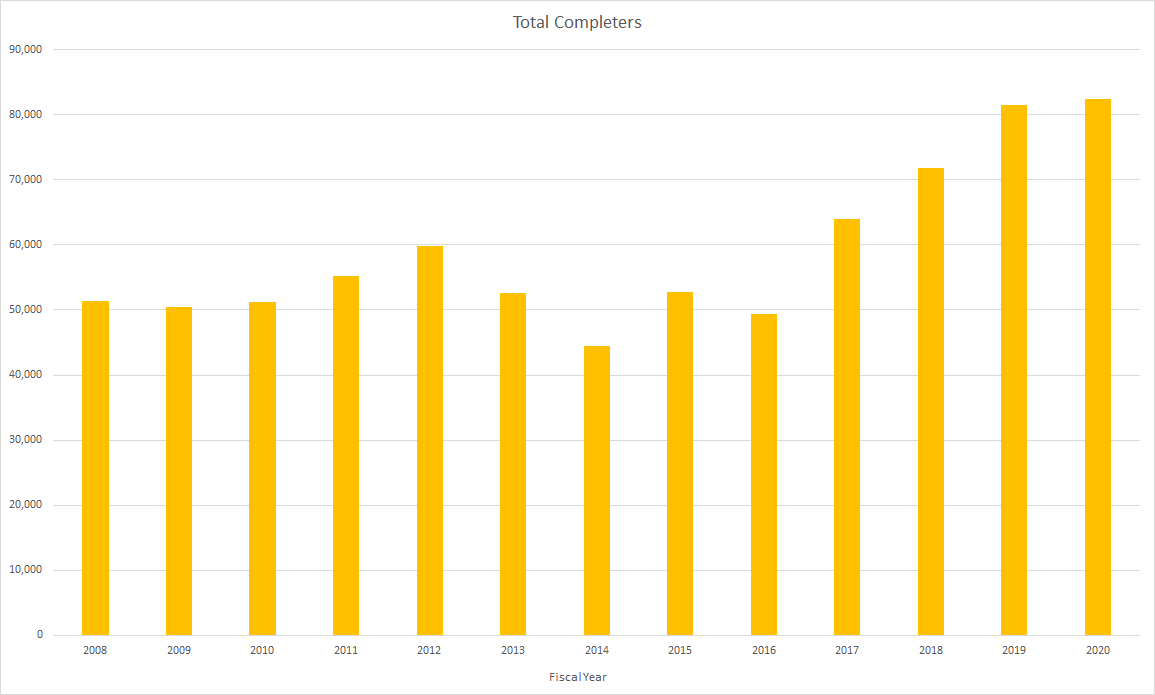
- 82,000 apprentices graduated from the apprenticeship system in FY 2020.
Apprenticeship Sponsors and Trends
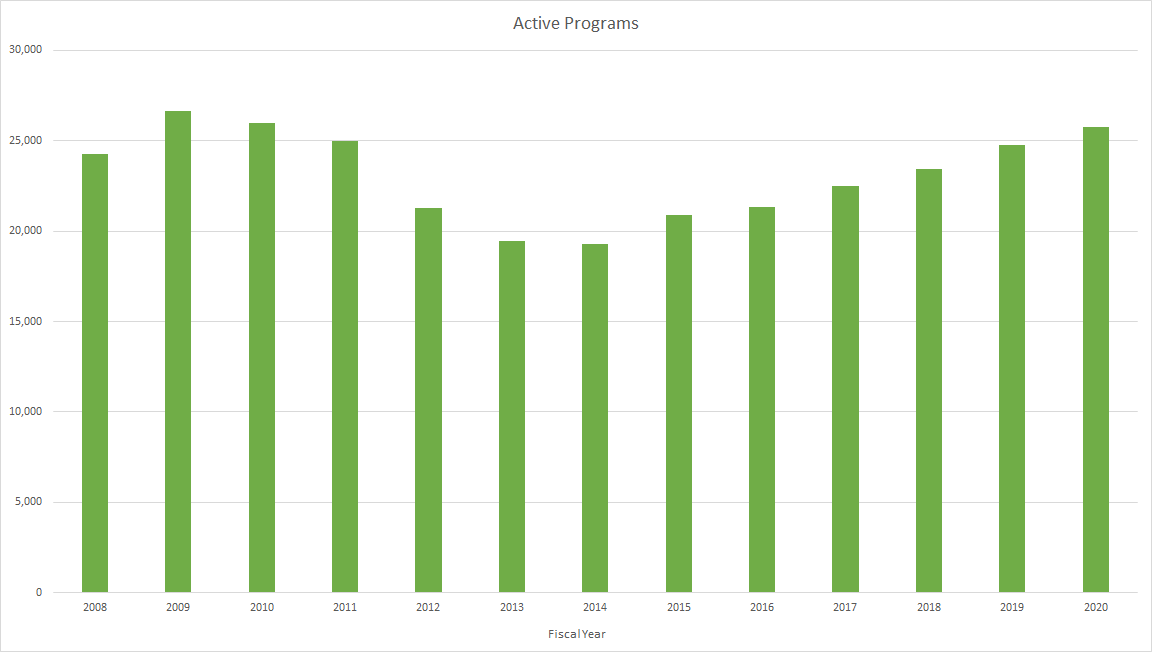
- There were nearly 26,000 registered apprenticeship programs active across the nation.
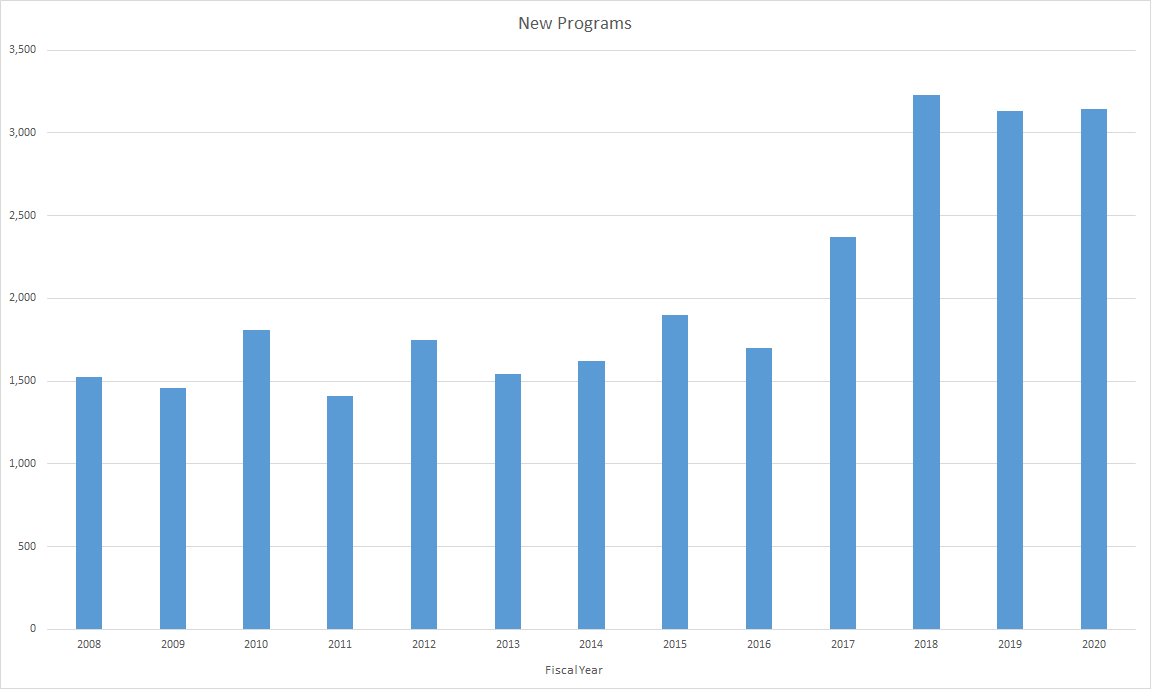
- 3,143 new apprenticeship programs were established nationwide in FY 2020, representing a 73% growth from 2009 levels.
Apprenticeship Data Files
Please visit the most recent Data and Statistics page to download historical data.
National Apprenticeship Data
National Registered Apprenticeship Results
| Fiscal Year | Active Apprentices | New Apprentices | Total Completers | Active Programs | New Programs |
| 2008 | 442,386 | 132,782 | 51,386 | 24,285 | 1,525 |
| 2009 | 420,140 | 110,707 | 50,493 | 26,622 | 1,456 |
| 2010 | 387,720 | 109,989 | 51,212 | 25,961 | 1,807 |
| 2011 | 357,692 | 130,391 | 55,178 | 24,967 | 1,409 |
| 2012 | 362,123 | 147,487 | 59,783 | 21,279 | 1,750 |
| 2013 | 375,425 | 164,746 | 52,542 | 19,431 | 1,540 |
| 2014 | 410,375 | 170,544 | 44,417 | 19,260 | 1,623 |
| 2015 | 447,929 | 197,535 | 52,717 | 20,910 | 1,898 |
| 2016 | 505,371 | 206,020 | 49,354 | 21,339 | 1,701 |
| 2017 | 533,607 | 191,563 | 64,021 | 22,488 | 2,369 |
| 2018 | 585,026 | 238,549 | 71,789 | 23,441 | 3,229 |
| 2019 | 633,476 | 252,271 | 81,552 | 24,778 | 3,133 |
| 2020 | 636,515 | 222,243 | 82,379 | 25,732 | 3,143 |
United Service Military Apprenticeship Program Data
The United Services Military Apprenticeship Program (USMAP) is a formal military training program that provides active duty Navy, Coast Guard, and Marine Corps service members the opportunity to improve their job skills and to complete their civilian apprenticeship requirements while they are on active duty. The U.S. Department of Labor provides the nationally-recognized Certificate of Completion upon program completion.
United Services Military Apprenticeship Program Data by Fiscal Year
| Item | 2008 | 2009 | 2010 | 2011 | 2012 | 2013 | 2014 | 2015 | 2016 | 2017 | 2018 | 2019 | 2020 |
| Active Apprentices | 51,645 | 58,652 | 69,870 | 62,404 | 73,748 | 87,675 | 95,452 | 95,770 | 95,001 | 89,301 | 98,435 | 109,878 | 122,767 |
| Active Male | 44,536 | 50,133 | 58,960 | 51,459 | 60,671 | 70,690 | 76,345 | 76,173 | 75,009 | 69,868 | 75,580 | 84,106 | 93,678 |
| Active Female | 7,109 | 8,519 | 10,910 | 10,945 | 13,077 | 16,985 | 19,107 | 19,597 | 19,992 | 19,433 | 22,855 | 25,772 | 29,089 |
| New Apprentices | 20,200 | 23,650 | 30,323 | 36,831 | 43,155 | 51,001 | 54,430 | 55,445 | 54,756 | 48,715 | 59,379 | 62,309 | 63,737 |
| Total Completers | 2,820 | 3,439 | 4,918 | 5,185 | 6,700 | 8,194 | 9,834 | 11,511 | 11,104 | 12,063 | 12,125 | 13,707 | 17,271 |
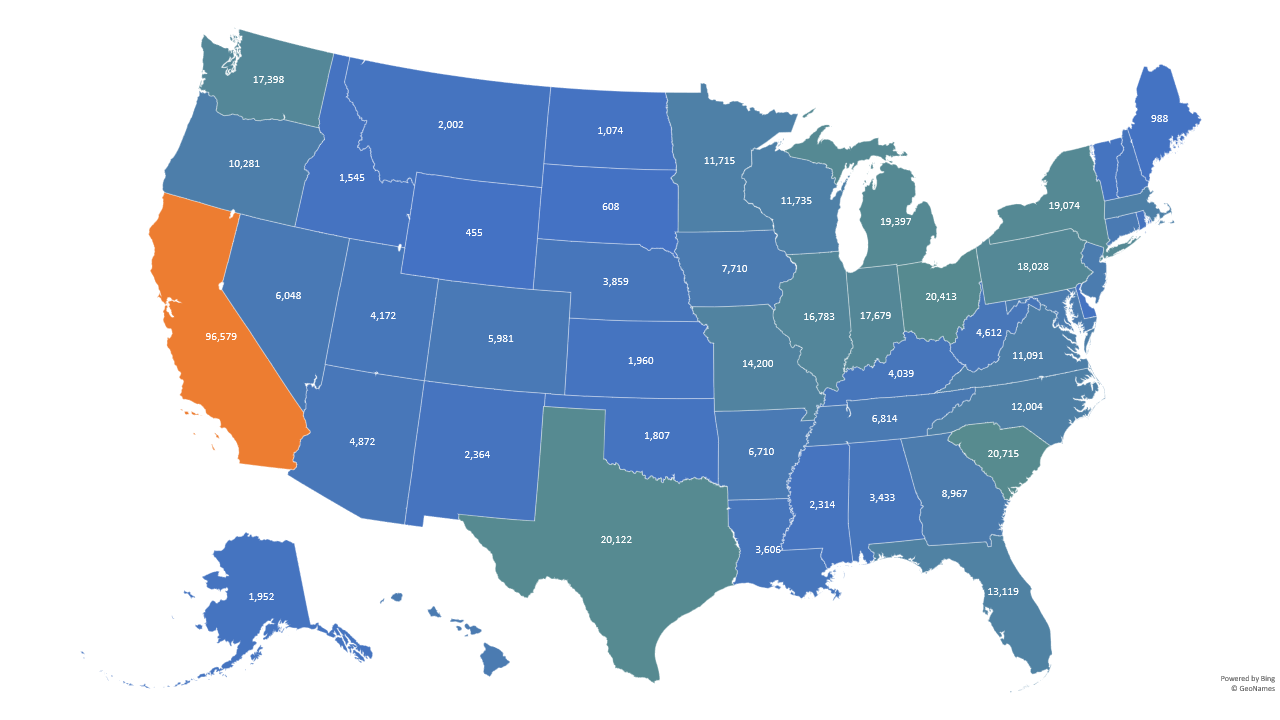
State Apprenticeship Data
Active Apprentices
New Apprentices

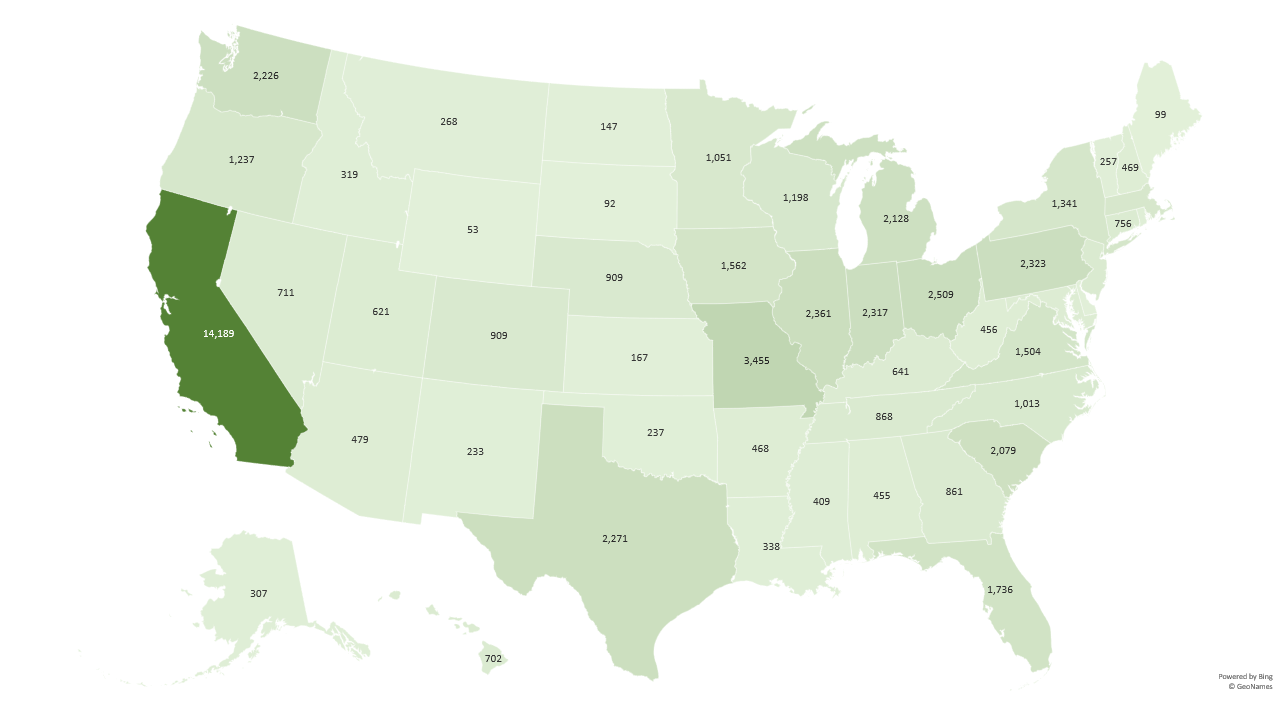
Graduates
Active Programs
New Programs
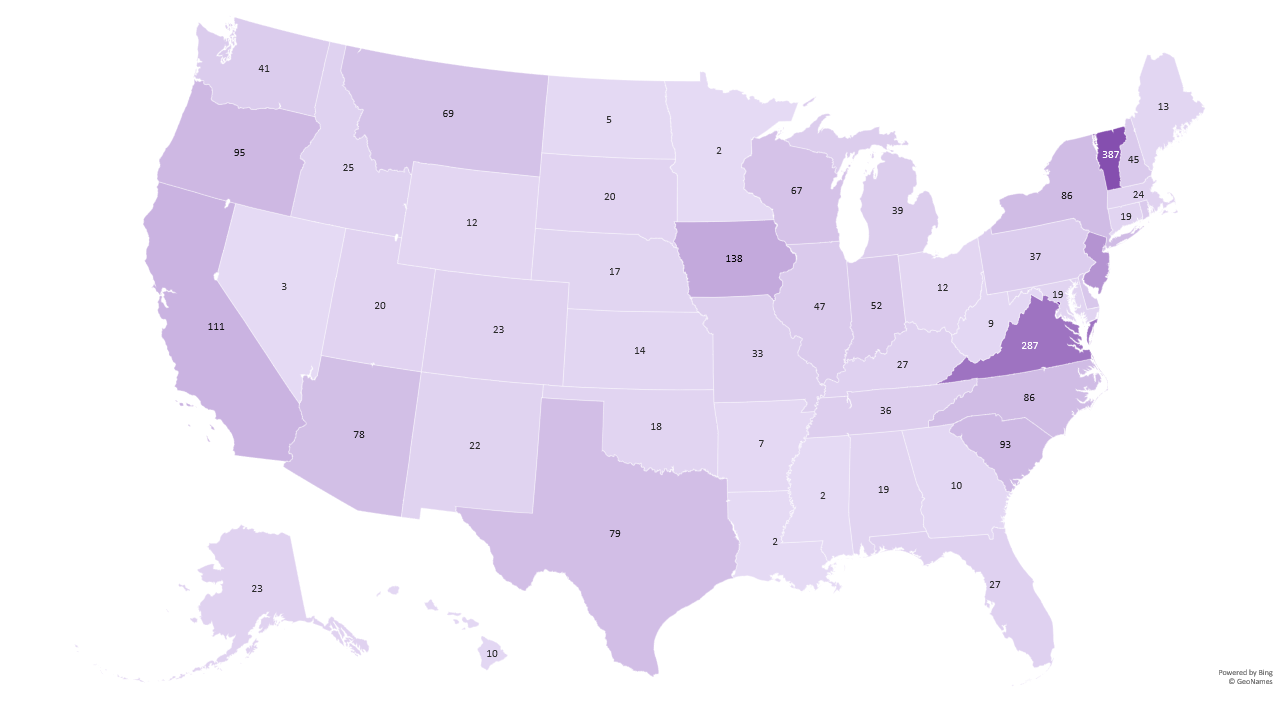
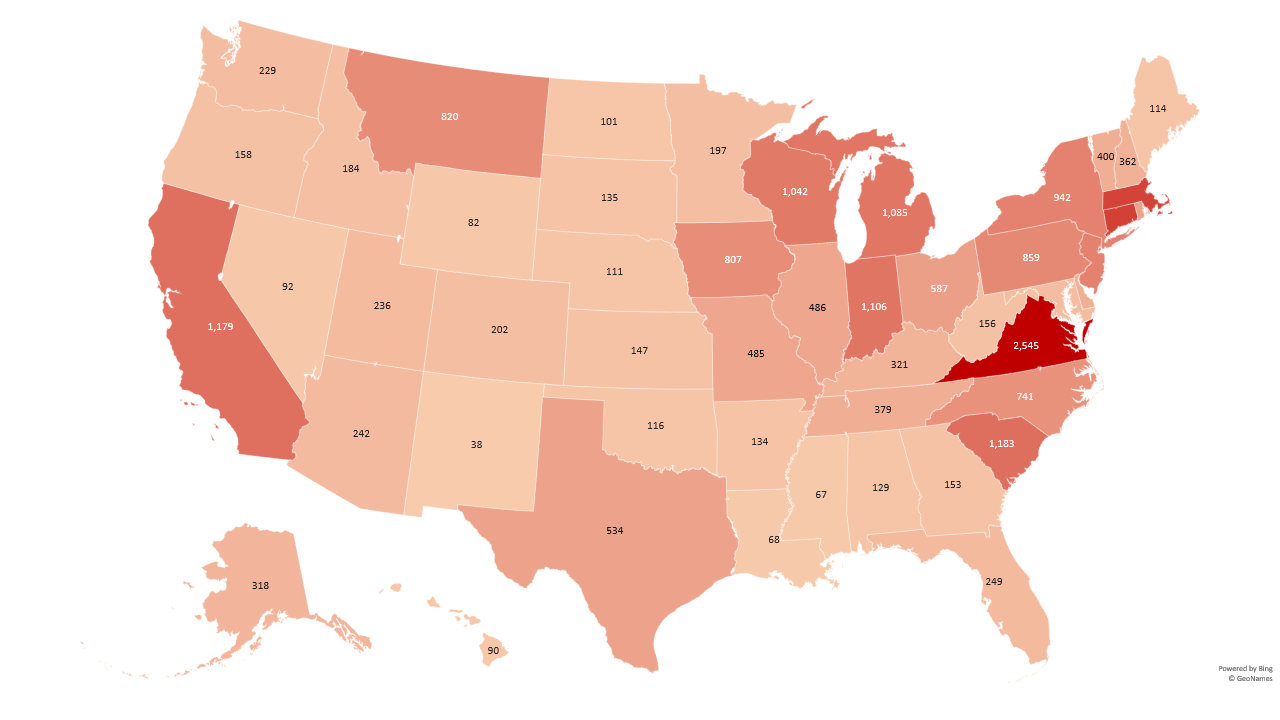
Fiscal Year 2020 State Totals
| State | Active Apprentices | New Apprentices | Completers | Active Programs | New Programs |
| AK | 1,952 | 681 | 307 | 318 | 23 |
| AL | 3,433 | 1,257 | 455 | 129 | 19 |
| AR | 6,710 | 2,284 | 468 | 134 | 7 |
| AZ | 4,872 | 1,841 | 479 | 242 | 78 |
| CA | 96,579 | 32,252 | 14,189 | 1,179 | 111 |
| CO | 5,981 | 2,521 | 909 | 202 | 23 |
| CT | 6,972 | 1,559 | 756 | 1,759 | 19 |
| DC | 5,848 | 1,564 | 482 | 197 | 472 |
| DE | 1,490 | 672 | 177 | 375 | 54 |
| FL | 13,119 | 4,226 | 1,736 | 249 | 27 |
| GA | 8,967 | 2,451 | 861 | 153 | 10 |
| GU | 591 | 263 | 30 | 122 | 3 |
| HI | 7,578 | 1,546 | 702 | 90 | 10 |
| IA | 7,710 | 3,059 | 1,562 | 807 | 138 |
| ID | 1,545 | 692 | 319 | 184 | 25 |
| IL | 16,783 | 4,144 | 2,361 | 486 | 47 |
| IN | 17,679 | 5,971 | 2,317 | 1,106 | 52 |
| KS | 1,960 | 554 | 167 | 147 | 14 |
| KY | 4,039 | 1,309 | 641 | 321 | 27 |
| LA | 3,606 | 812 | 338 | 68 | 2 |
| MA | 11,487 | 922 | 1,163 | 1,714 | 24 |
| MD | 8,711 | 990 | 584 | 214 | 19 |
| ME | 988 | 465 | 99 | 114 | 13 |
| MI | 19,397 | 5,834 | 2,128 | 1,085 | 39 |
| MN | 11,715 | 2,288 | 1,051 | 197 | 2 |
| MO | 14,200 | 7,373 | 3,455 | 485 | 33 |
| MS | 2,314 | 1,585 | 409 | 67 | 2 |
| MT | 2,002 | 790 | 268 | 820 | 69 |
| NC | 12,004 | 4,259 | 1,013 | 741 | 86 |
| ND | 1,074 | 290 | 147 | 101 | 5 |
| NE | 3,859 | 2,547 | 909 | 111 | 17 |
| NH | 2,957 | 1,012 | 469 | 362 | 45 |
| NJ | 8,583 | 1,712 | 846 | 936 | 198 |
| NM | 2,364 | 837 | 233 | 38 | 22 |
| NV | 6,048 | 2,023 | 711 | 92 | 3 |
| NY | 19,074 | 2,744 | 1,341 | 942 | 86 |
| OH | 20,413 | 6,902 | 2,509 | 587 | 12 |
| OK | 1,807 | 599 | 237 | 116 | 18 |
| OR | 10,281 | 3,038 | 1,237 | 158 | 95 |
| PA | 18,028 | 3,861 | 2,323 | 859 | 37 |
| PR | 136 | 126 | - | 9 | 5 |
| RI | 2,373 | 911 | 337 | 542 | 46 |
| SC | 20,715 | 5,987 | 2,079 | 1,183 | 93 |
| SD | 608 | 320 | 92 | 135 | 20 |
| TN | 6,814 | 2,354 | 868 | 379 | 36 |
| TX | 20,122 | 7,089 | 2,271 | 534 | 79 |
| UT | 4,172 | 1,625 | 621 | 236 | 20 |
| VA | 11,091 | 4,058 | 1,504 | 2,545 | 287 |
| VI | - | - | - | 2 | 2 |
| VT | 1,919 | 459 | 257 | 400 | 387 |
| WA | 17,398 | 4,550 | 2,226 | 229 | 41 |
| WI | 11,735 | 2,290 | 1,198 | 1,042 | 67 |
| WV | 4,612 | 1,201 | 456 | 156 | 9 |
| WY | 455 | 199 | 53 | 82 | 12 |
Data Note: The U.S. Department of Labor's Office of Apprenticeship uses a combination of individual records and aggregate state reports to calculate national totals as depicted on this webpage. The Registered Apprenticeship Partners Information Management Data System (RAPIDS) captures individual record data from 25 states administered by the Office of Apprenticeship and 18 of the 28 states/territories administered by a State Apprenticeship Agency (SAA). For SAA states that manage their data outside of RAPIDS, information is provided in the aggregate to the U.S. Department of Labor quarterly.
Federal Apprenticeship Data
The federal data below is a summary of the data managed by U.S. Department of Labor staff in the 25 states administered by the Office of Apprenticeship and federally administered programs in SAA states.
Federal Data by Fiscal Year
| Item | 2008 | 2009 | 2010 | 2011 | 2012 | 2013 | 2014 | 2015 | 2016 | 2017 | 2018 | 2019 | 2020 |
| Active Apprentices | 204,160 | 191,806 | 174,536 | 161,935 | 152,543 | 150,170 | 159,776 | 182,176 | 202,817 | 257,919 | 244,609 | 282,495 | 275,324 |
| New Apprentices | 83,017 | 64,690 | 53,233 | 57,809 | 62,167 | 67,195 | 69,487 | 89,210 | 91,777 | 106,117 | 112,365 | 120,102 | 91,943 |
| Program Completers | 37,466 | 29,054 | 29,393 | 29,957 | 29,284 | 26,141 | 22,380 | 23,578 | 24,965 | 27,749 | 33,741 | 38,963 | 36,395 |
| Active Programs | 12,146 | 11,915 | 11,404 | 10,223 | 10,166 | 9,539 | 8,828 | 8,606 | 8,610 | 9,117 | 9,227 | 9,946 | 10,165 |
| New Programs | 1,145 | 1,072 | 940 | 801 | 898 | 590 | 612 | 686 | 636 | 983 | 1,075 | 1,020 | 1,038 |
Federal Workload Data: Apprentices by Gender for Fiscal Year 2020*
| Gender | Active Apprentices | New Apprentices | Completers |
| Female | 25,367 | 10,408 | 4,204 |
| Male | 249,957 | 81,535 | 32,191 |
| Total | 275,324 | 91,943 | 36,395 |
Federal Workload Data: Apprentices Race for Fiscal Year 2020*
| Race | Active Apprentices | New Apprentices | Completers |
| Not Provided | 13,973 | 619 | 3,948 |
| American Indian or Alaska Native | 6,052 | 1,518 | 782 |
| Asian | 4,351 | 1,541 | 713 |
| Black or African American | 26,767 | 10,661 | 3,567 |
| Do not wish to answer | 58,073 | 21,706 | 4,492 |
| Multiple-Race Selected | 1,952 | 858 | 146 |
| Native Hawaiian or Other Pacific Islander | 2,289 | 742 | 329 |
| White | 161,867 | 54,298 | 22,418 |
| Total | 275,324 | 91,943 | 36,395 |
Federal Workload Data: Apprentices by Ethnicity for Fiscal Year 2020*
| Ethnicity | Active Apprentices | New Apprentices | Completers |
| Hispanic | 69,537 | 24,126 | 7,278 |
| Non-Hispanic | 147,288 | 50,293 | 19,990 |
| Not Provided | 58,499 | 17,524 | 9,127 |
| Total | 275,324 | 91,943 | 36,395 |
Federal Workload Data: Key Data by Program Type** for Fiscal Year 2020*
| Program Type | Active Apprentices | Active Programs | Percent Active Apprentices | Percent Active Programs |
| Employer Only (Non-Joint) | 105,301 | 8,545 | 38% | 84% |
| Joint Labor-Management | 170,023 | 1,621 | 62% | 16% |
**Program Types: Joint/Non-Joint and Group/Non-Group are short-hand terms used in the apprenticeship system to refer to various program types. “Joint” refers to programs that are run cooperatively by both an employer (or group of employers) and a labor organization. “Group” refers to whether the program involves a consortia of organizations/employers or involves a single employer (non-group). Almost all joint programs are also group programs (e.g. group joint program).
Federal Workload Data: Top 30 Occupations for Fiscal Year 2020*
| Occupation Title | Active Apprentices |
| Electrician | 44,547 |
| Carpenter | 25,553 |
| Construction Craft Laborer | 16,464 |
| Plumber | 15,711 |
| Truck Driver (Heavy) | 12,490 |
| Sheet Metal Worker | 8,172 |
| Pipe Fitter | 7,189 |
| Roofer | 5,638 |
| Structural Steel Worker/Ironworker | 5,517 |
| Line Maintainer | 5,044 |
| Millwright | 4,855 |
| Sprinkler Fitter | 4,810 |
| Operating Engineer | 4,309 |
| Drywall Applicator Specialist | 3,610 |
| Elevator Constructor | 3,473 |
| Cement Mason | 3,033 |
| Painter | 2,869 |
| Line Erector | 2,497 |
| Line Installer-Repairer | 2,303 |
| Heating & Air Conditioning Installer | 2,267 |
| Boilermaker | 2,230 |
| Protective Service Specialist | 2,034 |
| Nurse Assistant | 1,994 |
| GLAZIER(HY) | 1,952 |
| Drywall Applicator | 1,805 |
| Telecommunications Technician | 1,794 |
| Pharmacy Support Staff | 1,667 |
| Correction Officer | 1,653 |
| Maintenance Technician | 1,643 |
| Fitter | 1,433 |
Federal Data: Apprenticeship Statistics by Industry for Fiscal Year 2020*
| Industry Title | Active Apprentices | New Apprentices | Completers | Active Programs | New Programs |
| Construction | 188,452 | 57,644 | 20,749 | 4,793 | 466 |
| Public Administration | 18,959 | 7,214 | 3,839 | 635 | 31 |
| Manufacturing | 16,510 | 3,981 | 2,401 | 1,682 | 150 |
| Transportation and Warehousing | 13,020 | 6,691 | 2,659 | 145 | 18 |
| Utilities | 8,430 | 2,849 | 1,764 | 570 | 22 |
| Health Care and Social Assistance | 6,862 | 2,765 | 1,206 | 363 | 55 |
| Educational Services | 5,262 | 3,325 | 978 | 339 | 66 |
| Retail Trade | 3,598 | 1,596 | 616 | 368 | 42 |
| Information | 2,951 | 2102 | 387 | 105 | 10 |
| Not Provided | 2,724 | 551 | 516 | 367 | 16 |
| Accommodation and Food Services | 1,748 | 384 | 180 | 67 | 10 |
| Other Services (except Public Administration) | 1,663 | 619 | 175 | 195 | 38 |
| Wholesale Trade | 1,382 | 538 | 100 | 96 | 11 |
| Administrative and Support and Waste Management and Remediation Services | 1,250 | 725 | 300 | 141 | 31 |
| Agriculture, Forestry, Fishing and Hunting | 1029 | 381 | 131 | 23 | 5 |
| Professional, Scientific, and Technical Services | 751 | 431 | 191 | 196 | 54 |
| Mining, Quarrying, and Oil and Gas Extraction | 411 | 37 | 115 | 25 | 2 |
| Finance and Insurance | 188 | 94 | 75 | 31 | 5 |
| Real Estate and Rental and Leasing | 69 | 11 | 9 | 13 | 2 |
| Arts, Entertainment, and Recreation | 64 | 4 | 4 | 11 | 3 |
| Management of Companies and Enterprises | 1 | 1 | 0 | 1 | 1 |
| Grand Total | 275,324 | 91,943 | 36,395 | 10,166 | 1,038 |
Data Definitions
New Apprentices: Apprentices registered during the period (the start date, not the registration date is used).
New Programs: Programs registered during the period.
Active Apprentices: Includes registered, suspended, and reinstated apprentices.
Active Programs: Includes registered, suspended, and reinstated programs.
Active Apprentices/Programs: Active count at the end of a period (active at beginning of period plus new during period minus completed/cancelled during period).
Completers or Graduates: Apprentices that have completed their training during the period.
* Federal Workload data covers the 25 states administered by the U.S. Department of Labor's Office of Apprenticeship and national registered apprenticeship programs.