
Registered Apprenticeship National Results
Fiscal Year 2012 (10/01/2011 to 9/30/2012)
Registered Apprenticeship programs are developed and enhanced through strategic partnerships consisting of Office of Apprenticeship (OA) or a State Apprenticeship Agency (SAA), Registered Apprenticeship program sponsors, community-based organizations, educational institutions, the workforce system, and other stakeholders. These programs are sponsored and operated on a voluntary basis by individual employers, employer associations, or jointly through labor/management agreements.
Apprentices and Participation Trends
- In FY 2012, more than 147,000 individuals nationwide entered the apprenticeship system.
- Nationwide, there are over 358,000 apprentices currently obtaining the skills they need to succeed while earning the wages they need to build financial security.
- In FY 2012, over 59,000 participants graduated from the apprenticeship system.
Apprenticeship Sponsors and Trends
- There are over 21,000 registered apprenticeship programs across the nation.
- In FY 2012, more than 1,700 new apprenticeship programs were established nationwide.
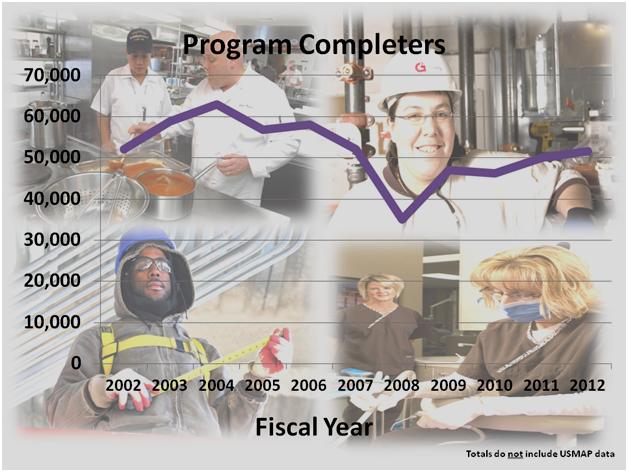
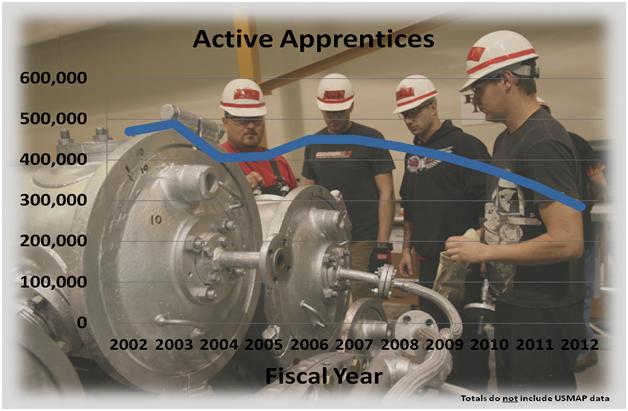
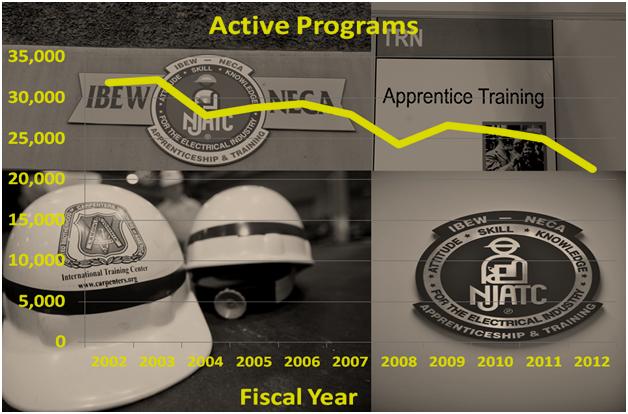
National Registered Apprenticeship Results*
| Fiscal Year | Active Apprentices | New Apprentices | Total Completers | Active Programs | New Programs |
|---|---|---|---|---|---|
| 2002 | 469,238 | 139,090 | 52,148 | 31,858 | 3,053 |
| 2003 | 488,927 | 134,343 | 58,816 | 32,196 | 3,346 |
| 2004 | 405,269 | 140,052 | 63,037 | 27,802 | 4,590 |
| 2005 | 409,040 | 151,632 | 56,849 | 28,810 | 3,448 |
| 2006 | 449,897 | 188,006 | 58,109 | 29,278 | 3,196 |
| 2007 | 451,056 | 192,128 | 52,109 | 27,976 | 3,271 |
| 2008 | 432,323 | 112,582 | 35,015 | 24,284 | 1,524 |
| 2009 | 408,383 | 87,057 | 47,054 | 26,621 | 1,456 |
| 2010 | 376,789 | 79,666 | 46,294 | 25,960 | 1,807 |
| 2011 | 336,265 | 93,560 | 49,993 | 24,966 | 1,409 |
| 2012 | 285,041 | 104,332 | 53,083 | 21,278 | 1,750 |
United Services Military Apprenticeship Program (USMAP)
| Item | FY 2008 | FY 2009 | FY 2010 | FY 2011 | FY 2012 |
|---|---|---|---|---|---|
| New Apprentices | 20,200 | 23,650 | 30,323 | 36,831 | 43,155 |
| Active Apprentices | 51,645 | 58,652 | 69,870 | 62,404 | 73,748 |
| Active Male | 44,536 | 50,133 | 58,960 | 51,459 | 60,671 |
| Active Female | 7,109 | 8,519 | 10,910 | 10,945 | 13,077 |
| Total Completers | 2,820 | 3,439 | 4,918 | 5,185 | 6,700 |
The United Services Military Apprenticeship Program (USMAP) is a formal military training program that provides active duty Navy, Coast Guard, and Marine Corps service members the opportunity to improve their job skills and to complete their civilian apprenticeship requirements while they are on active duty. The U.S. Department of Labor (DOL) provides the nationally recognized "Certificate of Completion" upon program completion.
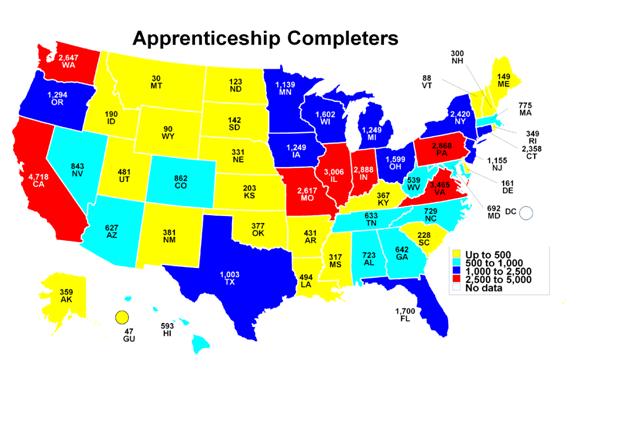
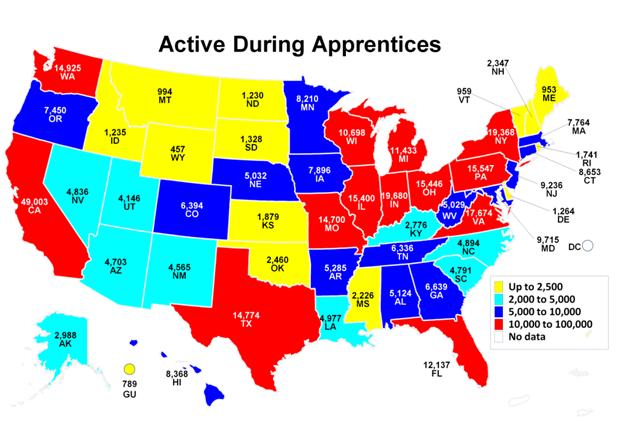
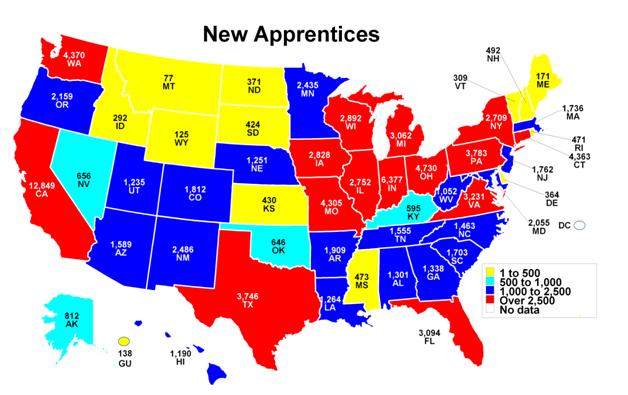
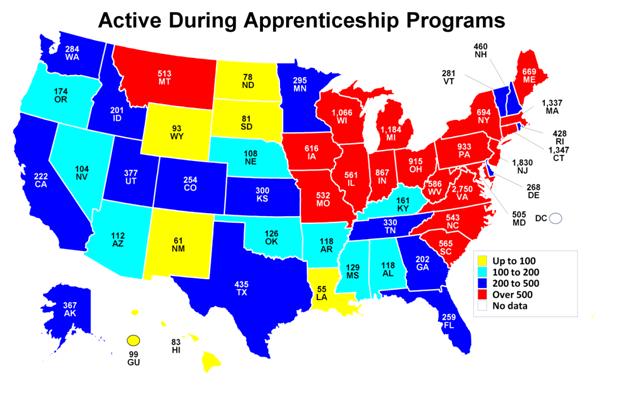
Fiscal Year 2012 State Totals
| State | Active During Apprentices | Active During Programs | New Apprentices | New Programs | Completers |
|---|---|---|---|---|---|
| Alabama | 5,124 | 118 | 1,301 | 11 | 723 |
| Alaska | 2,988 | 367 | 812 | 38 | 359 |
| Arizona | 4,703 | 112 | 1,589 | 8 | 627 |
| Arkansas | 5,285 | 118 | 1,909 | 6 | 431 |
| California | 49,003 | 222 | 12,849 | 5 | 4,718 |
| Colorado | 6,394 | 254 | 1,812 | 7 | 862 |
| Connecticut | 8,653 | 1,347 | 4,363 | 23 | 2,358 |
| Delaware | 1,264 | 268 | 364 | 161 | |
| District of Colombia | |||||
| Florida | 12,137 | 259 | 3,094 | 18 | 1,700 |
| Georgia | 6,639 | 202 | 1,338 | 4 | 642 |
| Guam | 789 | 99 | 138 | 15 | 47 |
| Hawaii | 8,368 | 83 | 1,190 | 1 | 593 |
| Idaho | 1,235 | 201 | 292 | 9 | 190 |
| Illinois | 15,400 | 561 | 2,752 | 23 | 3,006 |
| Indiana | 19,680 | 867 | 6,377 | 31 | 2,888 |
| Iowa | 7,896 | 616 | 2,828 | 138 | 1,249 |
| Kansas | 1,879 | 300 | 430 | 13 | 203 |
| Kentucky | 2,776 | 161 | 595 | 6 | 367 |
| Louisiana | 4,977 | 55 | 1,264 | 494 | |
| Maine | 953 | 669 | 171 | 46 | 149 |
| Maryland | 9,715 | 505 | 2,055 | 8 | 692 |
| Massachusetts | 7,764 | 1,337 | 1,736 | 112 | 775 |
| Michigan | 11,433 | 1,184 | 3,062 | 75 | 1,249 |
| Minnesota | 8,210 | 295 | 2,435 | 1,139 | |
| Mississippi | 2,226 | 129 | 473 | 13 | 317 |
| Missouri | 14,700 | 532 | 4,305 | 34 | 2,617 |
| Montana | 994 | 513 | 77 | 30 | |
| Nebraska | 5,032 | 108 | 1,251 | 5 | 331 |
| Nevada | 4,836 | 104 | 656 | 1 | 843 |
| New Hampshire | 2,347 | 460 | 492 | 22 | 300 |
| New Jersey | 9,236 | 1,830 | 1,762 | 64 | 1,155 |
| New Mexico | 4,565 | 61 | 2,486 | 381 | |
| New York | 19,368 | 694 | 2,709 | 29 | 2,420 |
| North Carolina | 4,894 | 543 | 1,463 | 54 | 729 |
| North Dakota | 1,230 | 78 | 371 | 5 | 123 |
| Ohio | 15,446 | 915 | 4,730 | 33 | 1,599 |
| Oklahoma | 2,460 | 126 | 646 | 7 | 377 |
| Oregon | 7,450 | 174 | 2,159 | 1,294 | |
| Pennsylvania | 15,547 | 933 | 3,783 | 54 | 2,868 |
| Rhode Island | 1,741 | 428 | 471 | 52 | 349 |
| South Carolina | 4,791 | 565 | 1,703 | 272 | 228 |
| South Dakota | 1,328 | 81 | 424 | 3 | 142 |
| Tennessee | 6,336 | 330 | 1,555 | 7 | 633 |
| Texas | 14,774 | 435 | 3,746 | 15 | 1,003 |
| Utah | 4,146 | 377 | 1,235 | 12 | 481 |
| Vermont | 959 | 281 | 309 | 35 | 88 |
| Virginia | 17,674 | 2,750 | 3,231 | 365 | 3,465 |
| Washington | 14,925 | 284 | 4,370 | 2,647 | |
| West Virginia | 5,029 | 586 | 1,052 | 27 | 539 |
| Wisconsin | 10,698 | 1,066 | 2,892 | 92 | 1,602 |
| Wyoming | 457 | 93 | 125 | 7 | 90 |
DATA NOTE: US DOL's Office of Apprenticeship uses a combination of individual records and aggregate state reports to calculate national totals as depicted on this webpage. The Registered Apprenticeship Partners Information Management Data System (RAPIDS) captures individual record data from 25 Office of Apprenticeship (OA) states and 8 of the 25 State Apprenticeship Agency (SAA) states. For SAA states that manage their data outside of RAPIDS, information is provided in the aggregate to US DOL on a quarterly basis.
| Definitions: | |
| New Apprentices: | Apprentices registered during the period (The begin date, not the registration date is used). |
| New Programs: | Programs registered during the period. |
| Active Apprentices: | include registered (RE), suspended (SU), and reinstated (RI) apprentices. |
| Active Programs: | include registered (RE) and reinstated (RI) programs. |
| Active During Apprentice/Program: | active during the period (active at begin of period + newly registered during this period based on begin date). |
| Active Apprentices/Programs at EOP: | Active at the end of period (active at BOP + new during period - completed/cancelled during period). |
| Completers: | Apprentices that have completed during the period. |
Top 10 Occupations for Fiscal Year 2012
Registered Apprenticeship has over 1,000 apprenticeable occupations across a variety of fields, but we're quite proud of our traditionally strong showing in the construction industry. Here are our Top 10 Occupations for the previous fiscal year, almost all of which are available in both Green industries and growing industries.
|
Top 10 Occupations for Fiscal Year 2012 |
|
|
Occupation Title |
Active Apprentices |
|
Electrician |
36,742 |
|
Carpenter |
15,479 |
|
Plumber |
13,201 |
|
Pipe Fitter |
8,586 |
|
Construction Craft Laborer |
7,947 |
|
Sheet Metal Worker |
7,714 |
|
Roofer |
5,479 |
|
Structural Steel/Ironworker |
5,041 |
|
Painter |
3,560 |
|
Pipe Fitter (Sprinkler Fitter) |
3,266 |
DATA NOTE: The data in the occupation table above is from 33 states. The Registered Apprenticeship Partners Information Management Data System (RAPIDS) is used by 25 Office of Apprenticeship (OA) states and 8 of the 25 State Apprenticeship Agency (SAA) states.