
The NAWSPAD map with the six regions:
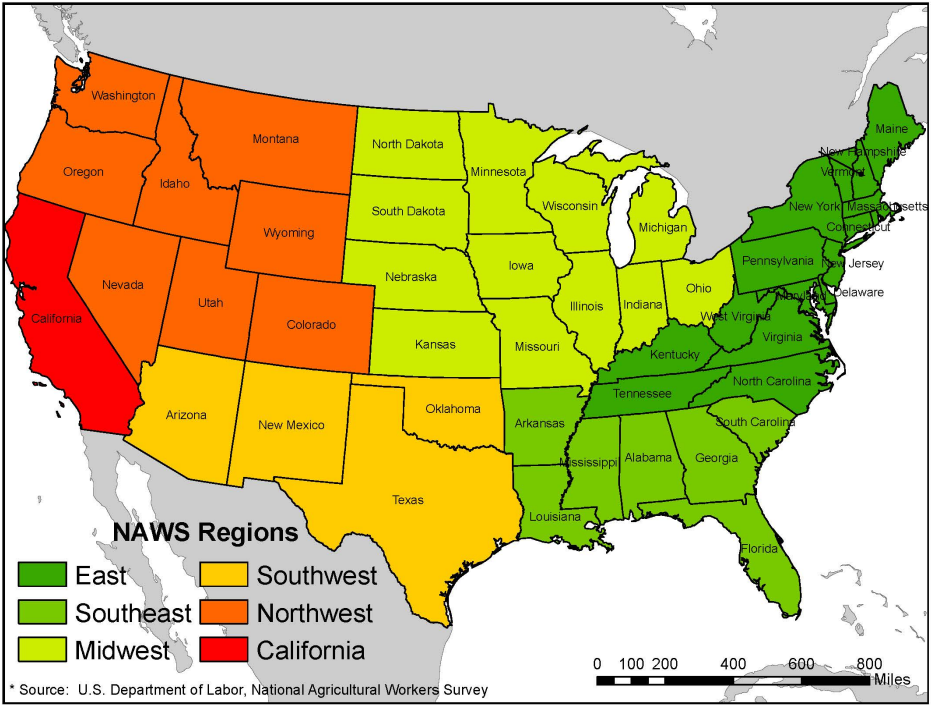
Table 1. NAWSPAD Regions and States
| Region No. | Region Name | States Represented |
|---|---|---|
| 1 | EAST | North Carolina, Virginia, Kentucky, Tennessee, West Virginia, Connecticut, Maine, Massachusetts, New Hampshire, New York, Rhode Island, Vermont, Delaware, Maryland, New Jersey, Pennsylvania |
| 2 | SOUTHEAST | Arkansas, Louisiana, Mississippi, Alabama, Georgia, South Carolina, Florida |
| 3 | MIDWEST | Illinois, Indiana, Ohio, Iowa, Missouri, Kansas, Nebraska, North Dakota, South Dakota, Michigan, Minnesota, Wisconsin |
| 4 | SOUTHWEST | Arizona, New Mexico, Oklahoma, Texas |
| 5 | NORTHWEST | Idaho, Montana, Wyoming, Colorado, Nevada, Utah, Oregon, Washington |
| 6 | CALIFORNIA | California |
Table 2. Number of Interviews by Fiscal Year and Region
| Fiscal Year | Region 1 East | Region 2 Southeast | Region 3 Midwest | Region 4 Southwest | Region 5 Northwest | Region 6 California | Total |
|---|---|---|---|---|---|---|---|
| 1989 | 311 | 504 | 322 | 269 | 324 | 796 | 2,526 |
| 1990 | 149 | 571 | 58 | 300 | 230 | 810 | 2,118 |
| 1991 | 149 | 731 | 88 | 321 | 279 | 1,032 | 2,600 |
| 1992 | 147 | 552 | 87 | 235 | 201 | 674 | 1,896 |
| 1993 | 423 | 351 | 442 | 248 | 265 | 664 | 2,393 |
| 1994 | 478 | 320 | 454 | 221 | 290 | 611 | 2,374 |
| 1995 | 347 | 306 | 411 | 237 | 354 | 708 | 2,363 |
| 1996 | 264 | 371 | 306 | 242 | 277 | 591 | 2,051 |
| 1997 | 338 | 397 | 257 | 242 | 264 | 602 | 2,100 |
| 1998 | 319 | 428 | 262 | 236 | 262 | 592 | 2,099 |
| 1999 | 569 | 487 | 546 | 239 | 489 | 1,282 | 3,612 |
| 2000 | 383 | 603 | 440 | 223 | 528 | 1,409 | 3,586 |
| 2001 | 414 | 548 | 393 | 177 | 417 | 1,162 | 3,111 |
| 2002 | 445 | 585 | 478 | 224 | 431 | 1,198 | 3,361 |
| 2003 | 464 | 616 | 499 | 266 | 477 | 1,263 | 3,585 |
| 2004 | 413 | 519 | 455 | 171 | 407 | 1,081 | 3,046 |
| 2005 | 314 | 337 | 374 | 118 | 314 | 770 | 2,227 |
| 2006 | 176 | 300 | 196 | 116 | 196 | 535 | 1,519 |
| 2007 | 197 | 294 | 176 | 100 | 193 | 551 | 1,511 |
| 2008 | 316 | 407 | 211 | 142 | 265 | 841 | 2,182 |
| 2009 | 276 | 392 | 231 | 162 | 337 | 821 | 2,219 |
| 2010 | 202 | 299 | 126 | 109 | 192 | 544 | 1,472 |
| 2011 | 181 | 146 | 175 | 114 | 315 | 589 | 1,520 |
| 2012 | 205 | 174 | 218 | 105 | 209 | 594 | 1,505 |
| 2013 | 194 | 152 | 213 | 116 | 199 | 538 | 1,412 |
| 2014 | 331 | 426 | 325 | 164 | 476 | 1,101 | 2,823 |
| 2015 | 411 | 392 | 364 | 232 | 397 | 1,038 | 2,834 |
| 2016 | 293 | 312 | 174 | 215 | 398 | 1,116 | 2,508 |
| 2017 | 150 | 148 | 100 | 127 | 207 | 506 | 1,238 |
| 2018 | 157 | 130 | 159 | 95 | 213 | 594 | 1,348 |
| 2019 | 173 | 150 | 114 | 84 | 204 | 328 | 1,053 |
| 2020 | 117 | 95 | 84 | 78 | 168 | 577 | 1,119 |
| 2021 | 111 | 74 | 106 | 80 | 250 | 578 | 1,119 |
| 2022 | 150 | 134 | 98 | 119 | 2668 | 632 | 1,399 |
| Total | 9,567 | 12,251 | 8,942 | 6,127 | 10,297 | 26,728 | 73,909 |