

Unemployment Rates by Disability and Veteran Status
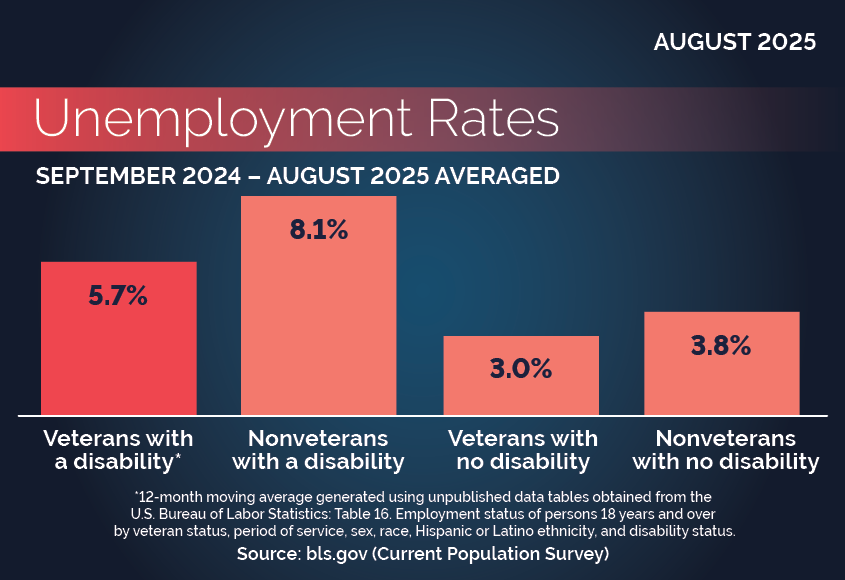
September 2024 – August 2025 Averaged*
Veterans with a disability 5.7%,
Nonveterans with a disability 8.1%,
Veterans with no disability 3.0%,
Nonveterans with no disability 3.8%.
*12-month moving average generated using unpublished data tables from the Disability package obtained from the U.S. Bureau of Labor Statistics: Table 16. Employment status of persons 18 years and over by veteran status, period of service, sex, race, Hispanic or Latino ethnicity, and disability status. The unemployment rates are not seasonally adjusted for individuals aged 18 years and over in the civilian non-institutional population.
Source: bls.gov (Current Population Survey)
Labor Force Participation Statistics
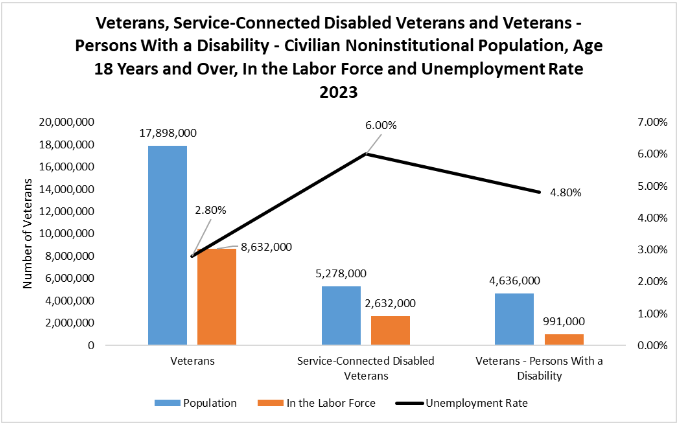
Veterans, Service-Connected Disabled Veterans and Veterans - Persons With a Disability - Civilian Noninstitutional Population, Age 18 Years and Over, In the Labor Force and Unemployment Rate 2023
Source: Table 7. Employment status of veterans 18 years and over by presence of service-connected disability, reported disability rating, period of service, and sex, 2023, not seasonally adjusted.
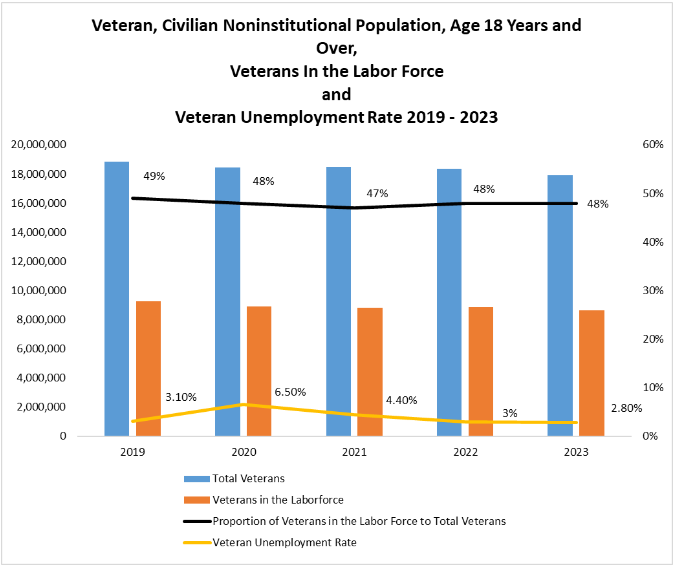
Veteran, Civilian Noninstitutional Population, Age 18 Years and Over, Veterans In the Labor Force and Veteran Unemployment Rate 2019 - 2023
Source: Table 1. Employment status of persons 18 years and over by veteran status, period of service, sex, race, and Hispanic or Latino ethnicity, 2019 - 2023 annual averages.
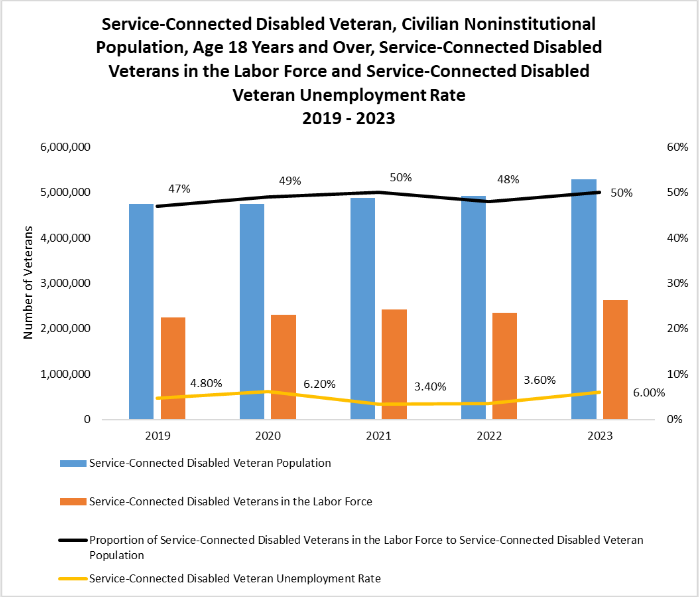
Service-connected Disabled Veteran, Civilian Noninstitutional Population, Age 18 Years and Over, Service-connected Disabled Veterans in the Labor Force and Service-connected Disabled Veteran Unemployment Rate 2019 - 2023
Source: Table 7. Employment status of veterans 18 years and over by presence of service-connected disability, reported disability rating, period of service, and sex, 2019 – 2023, not seasonally adjusted.
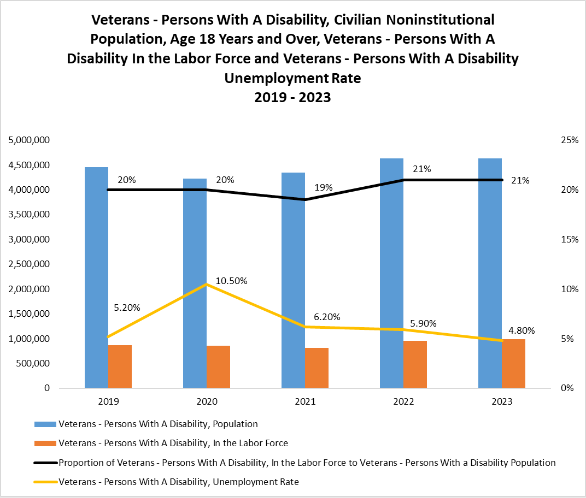
Veterans - persons With A Disability, Civilian Noninstitutional Population, Age 18 Years and Over, Veterans - Persons With A Disability In the Labor Force and Veterans - Persons With A Disability Unemployment Rate 2019 - 2023
Source: Employment status of persons 18 years and over by veteran status, period of service, sex, race, Hispanic or Latino ethnicity, and disability status, Annual Average 2019 – 2023, Current Population Survey, Unpublished Tables.
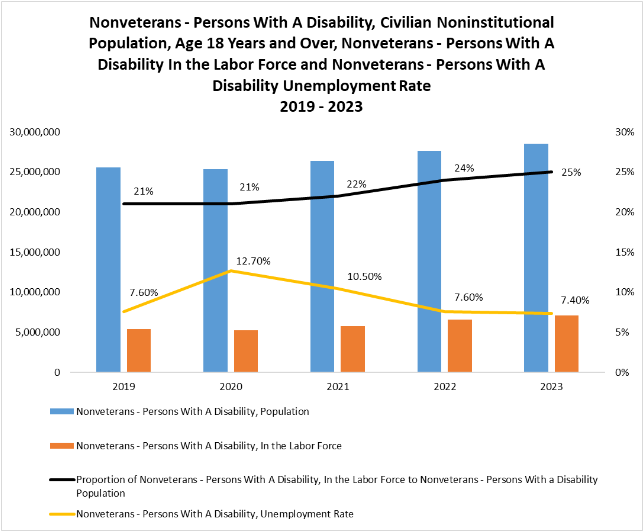
Nonveterans - Persons With A Disability, Civilian Noninstitutional Population, Age 18 Years and Over, Nonveterans - Persons With A Disability In the Labor Force and Nonveterans- Persons With A Disability Unemployment Rate 2019 - 2023
Source: Employment status of persons 18 years and over by veteran status, period of service, sex, race, Hispanic or Latino ethnicity, and disability status, Annual Average 2019 – 2023, Current Population Survey, Unpublished Tables.
For more information, read the Labor Force Statistics of Veterans with Disabilities (PDF) fact sheet.
Veteran Education and Employment Programs 2016-2021
Employment situation of veterans and service-connected disabled veterans, and how these veteran populations experience federal employment and education programs, American Job Center (AJC) services, and services provided by Disabled Veterans’ Outreach Program (DVOP) specialists.
Veteran Education and Employment Programs 2016 - 2021 (PDF)
Disability Index Report
Disability:IN is the leading nonprofit resource for business disability worldwide. Our network of over 500 corporations expands opportunities for people with disabilities across enterprises. Our central office and 25 Affiliates serve as the collective voice to effect change for people with disabilities in business.
- 2024 Disability Index Report (disabilityin.org, PDF)
- 2023 Disability Index Report (disabilityin.org, PDF)
- 2022 Disability Index Report (disabilityin.org, PDF)
Annual employment for veterans with a service-connected disability, age 18+
August 2023
In August 2023, there were 5.27 million veterans with a service-connected disability in the civilian non-institutional population 18 years and over.
| Presence of service-connected disability | Civilian Labor Force | Unemployment Rate (August 2023) |
|---|---|---|
| With service-connected disability | 2,632,000 | 6.0% |
| Less than 30 percent disability rating | 594,000 | 8.9% |
| 30 to 50 percent disability rating | 500,000 | 3.9% |
| 60 percent or higher | 1,362,000 | 5.7% |
| Without service-connected disability | 5,563,000 | 3.1% |
August 2022
In August 2022, there were 4.92 million veterans with a service-connected disability in the civilian non-institutional population 18 years and over.
| Presence of service-connected disability | Civilian Labor Force | Unemployment Rate (August 2022) |
|---|---|---|
| With service-connected disability | 2,345,000 | 3.6% |
| Less than 30 percent disability rating | 603,000 | 3.5% |
| 30 to 50 percent disability rating | 451,000 | 4.0% |
| 60 percent or higher | 1,094,000 | 3.7% |
| Without service-connected disability | 6,024,000 | 2.7% |