Private Pension Plan Bulletin
Abstract of 1997 Form 5500 Annual Reports
U.S. Department of Labor
Pension and Welfare Benefits Administration
Office of Policy and Research
Number 10, Winter 2001
Introduction
This is the tenth edition of the Private Pension Plan Bulletin. The tabulations presented in this report contain data based on 1997 Form 5500 filings. Reports for 1997 plan years were filed by plans for fiscal years beginning anywhere from January 1, 1997 to December 30, 1997. The Internal Revenue Service (IRS) processed 1997 filings from August 1998 through July 2000.
Form 5500 reports are filed annually with the IRS. Plans covering 100 or more participants must file a Form 5500 every year containing extensive financial, participant, and actuarial data. Plans covering fewer than 100 participants are required to file a less detailed report (known as a Form 5500 C/R).
The universe for this Bulletin consists of all private pension plans for which a Form 5500 or Form 5500 C/R has been filed with the IRS in accordance with Title I of the Employee Retirement Income Security Act of 1974 (ERISA). Such plans may be defined benefit or defined contribution plans. They generally cover private wage and salary employees and are sponsored either by employers or jointly by employers and unions.
The IRS processes the reports and provides computerized edited files to the Department of Labor's Pension and Welfare Benefits Administration. To produce this report, data on all plans covering 100 or more participants are combined with a 5 percent sample of small plan filers. This combined file is subjected to additional editing and weighted to represent the universe of private pension plans covering two or more participants.
Key findings from the 1997 filings are summarized in the Highlights on pages 2 and 3. The tabulations are organized into five sections. Section A contains summary data on plans, participants, assets, income and expenses. Section B contains more detailed data on plans and participants, showing distributions by different size measures. Section C contains balance sheets and income statements for the major types of pension plans. Section D contains detailed data on defined contribution plans. Section E contains historical data from 1978 to 1997. The organization of this Bulletin is similar to the previous edition with the exception of an additional table in Section B on terminated and merged plans and an additional table in Section D on participant direction of investments of 401(k) plan assets.
This publication was prepared by Richard Hinz, Helen Lawrence, David McCarthy, Daniel Beller, Steve Donahue, and Phyllis Fernandez of the Office of Policy and Research. Although this Bulletin is not copyrighted, proper acknowledgment would be appreciated. The recommended citation is:
United States Department of Labor, Pension and Welfare Benefits Administration. Abstract of 1997 Form 5500 Annual Reports. Private Pension Plan Bulletin No. 10, Winter 2001, Washington, DC.
Contents
- Section A: Summary
- Table A1: Number of Pension Plans, Total Participants, Active Participants, Assets, Contributions, and Benefits by type of plan, 1997
- Table A2: Number of Participants in Pension Plans by type of plan entity, type of plan, and type of participant, 1997
- Table A3: Balance Sheet of Pension Plans by type of plan, 1997
- Table A4: Income Statement of Pension Plans by type of plan, 1997
- Table A5: Amount of Assets in Pension Plans by type of plan and method of funding, 1997
- Table A6: Collective Bargaining Status of Pension Plans, Participants, and Assets by type of plan, 1997
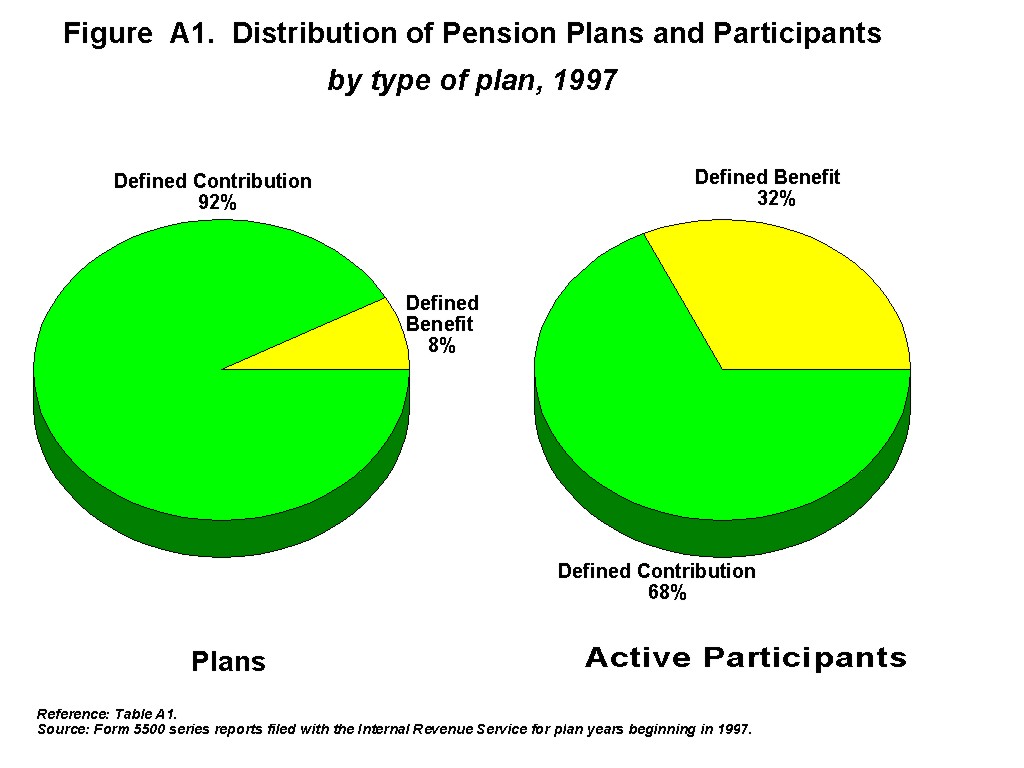
- Figure A1: Distribution of Pension Plans and Participants by type of plan, 1997
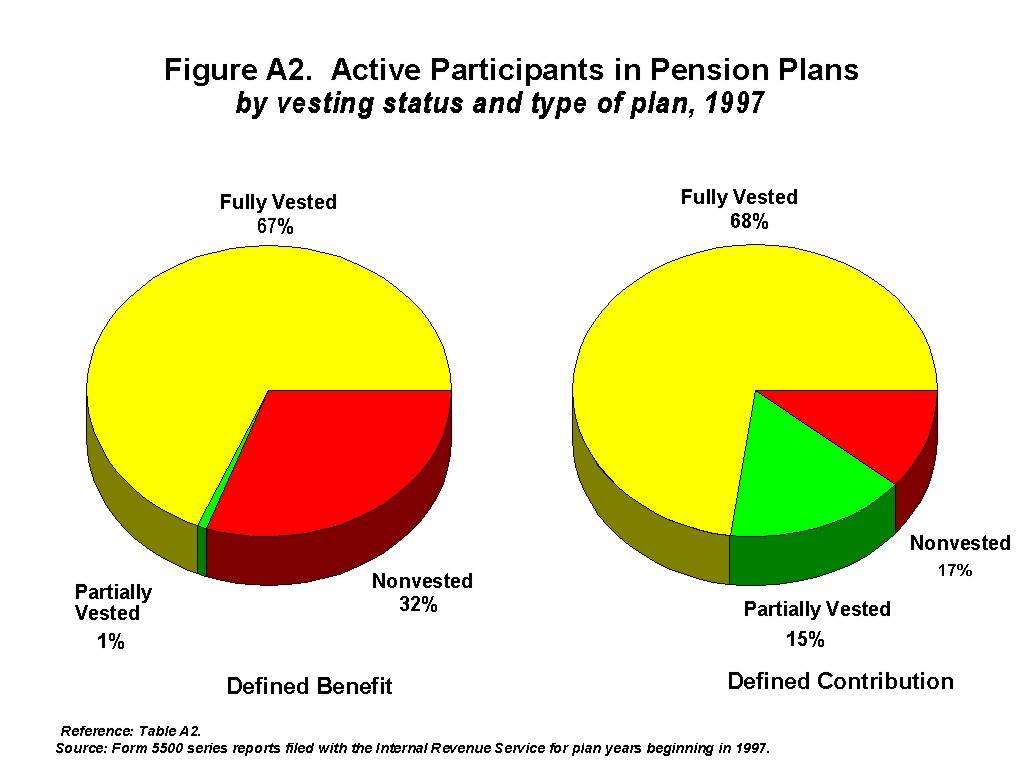
- Figure A2: Active Participants in Pension Plans by vesting status and type of plan, 1997
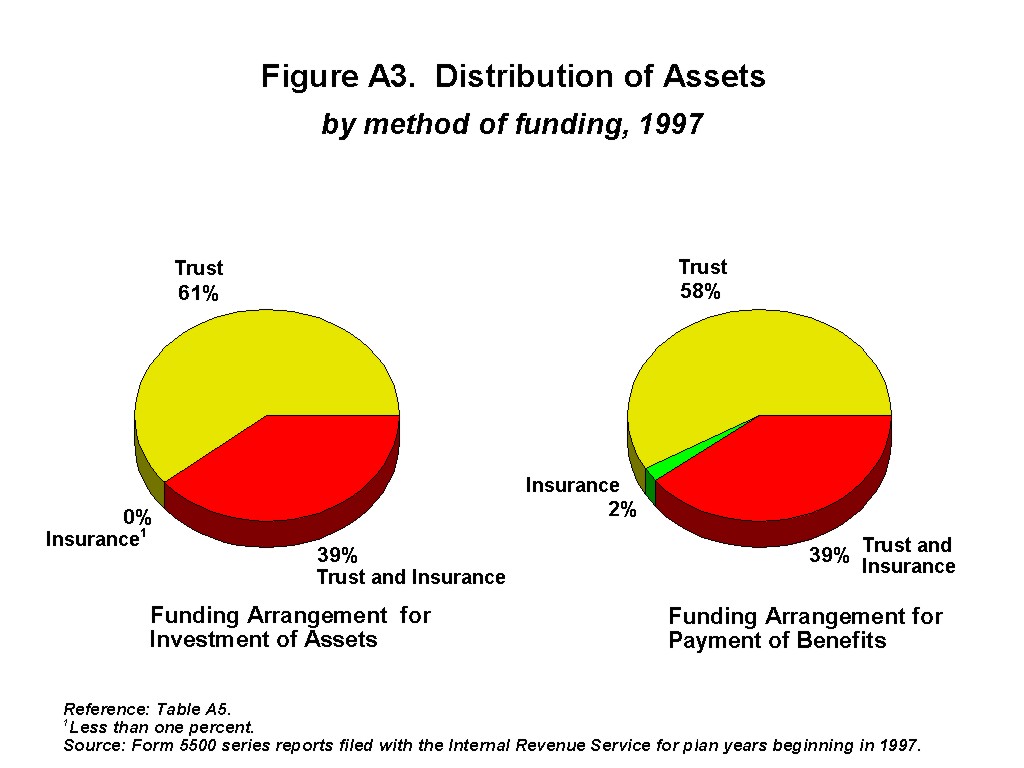
- Figure A3: Distribution of Assets by method of funding, 1997
- Section B: Plans and Participants
- Table B1: Distribution of Pension Plans by number of participants, 1997
- Table B2: Distribution of Pension Plans by amount of assets, 1997
- Table B3: Distribution of Pension Plans by industry, 1997
- Table B4: Distribution of Participants by number of participants, 1997
- Table B5: Distribution of Participants by amount of assets, 1997
- Table B6: Distribution of Participants by industry, 1997
- Table B7: Distribution of Active Participants by type of plan, 1997
- Table B8: Number of Plans by type of plan and method of funding, 1997
- Table B9: Number of Participants by type of plan and method of funding, 1997
- Table B10: Percent Distribution of Plans Filing Final Form 5500 Reports by type of plan, size of plan, and reason for final filing, 1997
- Section C: Financial
- Table C1: Distribution of Assets by number of participants, 1997
- Table C2: Distribution of Assets by asset size, 1997
- Table C3: Distribution of Assets by industry, 1997
- Table C4: Balance Sheet of Pension Plans with 100 or More Participants by type of plan, 1997
- Table C5: Balance Sheet of Single Employer Pension Plans with 100 or More Participants by type of plan, 1997
- Table C6: Balance Sheet of Multiemployer Pension Plans with 100 or More Participants by type of plan, 1997
- Table C7: Percentage Distribution of Assets in Defined Benefit Pension Plans with 100 or More Participants by type of asset and size of plan, 1997
- Table C8: Percentage Distribution of Assets in Defined Contribution Pension Plans with 100 or More Participants by type of asset and size of plan, 1997
- Table C9: Income Statement of Pension Plans with 100 or More Participants by type of plan, 1997
- Table C10: Income Statement of Single Employer Pension Plans with 100 or More Participants by type of plan, 1997
- Table C11: Income Statement of Multiemployer Pension Plans with 100 or More Participants by type of plan, 1997
- Table C12: Percentage Distribution of Income in Defined Benefit Plans with 100 or More Participants by source of income and size of plan, 1997
- Table C13: Percentage Distribution of Income in Defined Contribution Plans with 100 or More Participants by source of income and size of plan, 1997
- Figure C1: Average Assets per Participant by plan size, 1997
- Figure C2: Distribution of Pension Plans, Participants and Assets by plan size, 1997
- Section D: Defined Contribution Plans
- Table D1: Balance Sheet of Defined Contribution Plans with 100 or More Participants by type of plan, 1997
- Table D2: Income Statement of Defined Contribution Plans with 100 or More Participants by type of plan, 1997
- Table D3: Number of 401(k) Type Plans, Participants, Active Participants, Assets, Contributions, and Benefits by type of plan, 1997
- Table D4: Number of 401(k) Type Plans by number of participants and primary or supplemental status, 1997
- Table D5: Number of Active Participants in 401(k) Type Plans by number of participants and primary or supplemental status, 1997
- Table D6: Number of 401(k) Type Plans, Participants, and Assets by size of plan and participant direction status, 1997
- Table D7: Balance Sheet of 401(k) Type Plans 1997
- Table D8: Income Statement of 401(k) Type Plans 1997
- Table D9: Balance Sheet of 401(k) Type Plans with 100 or More Participants 1997
- Table D10: Income Statement of 401(k) Type Plans With 100 or More Participants 1997
- Table D11: Number of Employee Stock Ownership Plans (ESOPs), Total Participants, Active Participants, Assets, Contributions, and Benefits by type of assets, 1997
- Table D12: Number of Employee Stock Ownership Plans (ESOPs), Total Participants, Active Participants, Assets, Contributions, and Benefits by type of ESOP, 1997
- Table D13: Number of Employee Stock Ownership Plans (ESOPs) by number of participants and primary or supplemental status, 1997
- Table D14: Balance Sheet of Employee Stock Ownership Plans (ESOPs) with 100 or More Participants by leveraged status, 1997
- Table D15: Income Statement of Employee Stock Ownership Plans (ESOPs) with 100 or More Participants by leveraged status, 1997
- Section E: Historical Tables
- Table E1: Number of Pension Plans by type of plan, 1978-1997
- Table E2: Number of Pension Plans with Fewer than 100 Participants by type of plan, 1978-1997
- Table E3: Number of Pension Plans with 100 or More Participants by type of plan, 1978-1997
- Table E4: Estimated Private Wage and Salary Worker Participation Rates Under Primary and Supplemental Pension Plans 1978-1997
- Table E5: Number of Participants in Pension Plans by type of plan, 1978-1997
- Table E6: Number of Participants in Pension Plans with Fewer than 100 Participants by type of plan, 1978-1997
- Table E7: Number of Participants in Pension Plans with 100 or More Participants by type of plan, 1978-1997
- Table E8: Number of Active Participants in Pension Plans by type of plan, 1978-1997
- Table E9: Number of Active Participants in Pension Plans with Fewer than 100 Participants by type of plan, 1978-1997
- Table E10: Number of Active Participants in Pension Plans with 100 or More Participants by type of plan, 1978-1997
- Table E11: Pension Plan Assets by type of plan, 1978-1997
- Table E12: Pension Plan Assets of Plans with Fewer than 100 Participants by type of plan, 1978-1997
- Table E13: Pension Plan Assets of Plans with 100 or More Participants by type of plan, 1978-1997
- Table E14: Pension Plan Contributions by type of plan, 1978-1997
- Table E15: Pension Plan Contributions of Plans with Fewer than 100 Participants by type of plan, 1978-1997
- Table E16: Pension Plan Contributions of Plans with 100 or More Participants by type of plan, 1978-1997
- Table E17: Pension Plan Benefits Disbursed by type of plan, 1978-1997
- Table E18: Pension Plan Benefits Disbursed From Plans with Fewer than 100 Participants by type of plan, 1978-1997
- Table E19: Pension Plan Benefits Disbursed From Plans with 100 or More Participants by type of plan, 1978-1997
- Table E20: Percentage Distribution of Active Participants in Plans with 100 or More Participants by vesting status, 1978-1997
- Table E21: Percentage Distribution of Active Participants in Single Employer Plans with 100 or More Participants by vesting status, 1978-1997
- Table E22: Percentage Distribution of Active Participants in Multiemployer Plans with 100 or More Participants by vesting status, 1978-1997
- Table E23: Number of 401(k) Type Plans, Participants, Assets, Contributions, and Benefit Payments 1984-1997
- Table E24: Aggregate Rates of Return Earned by Pension Plans with 100 or More Participants 1985-1997
- Table E25: Aggregate Investment Performance of Private Pension Plans with 100 or More Participants 1985-1997
- Table E26: Aggregate Rates of Return Earned by Employee Stock Ownership Plans (ESOPs) and 401(k) Plans with 100 or More Participants 1990-1997
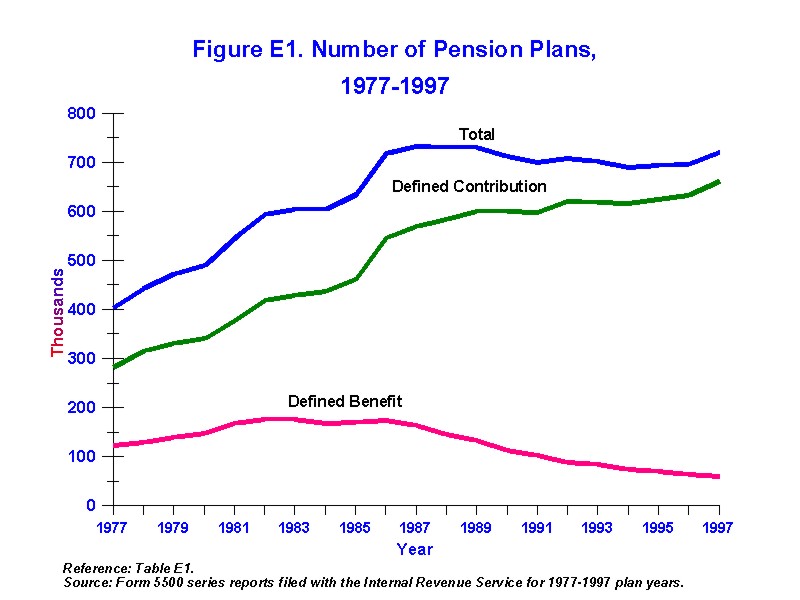
- Figure E1: Number of Pension Plans 1978-1997
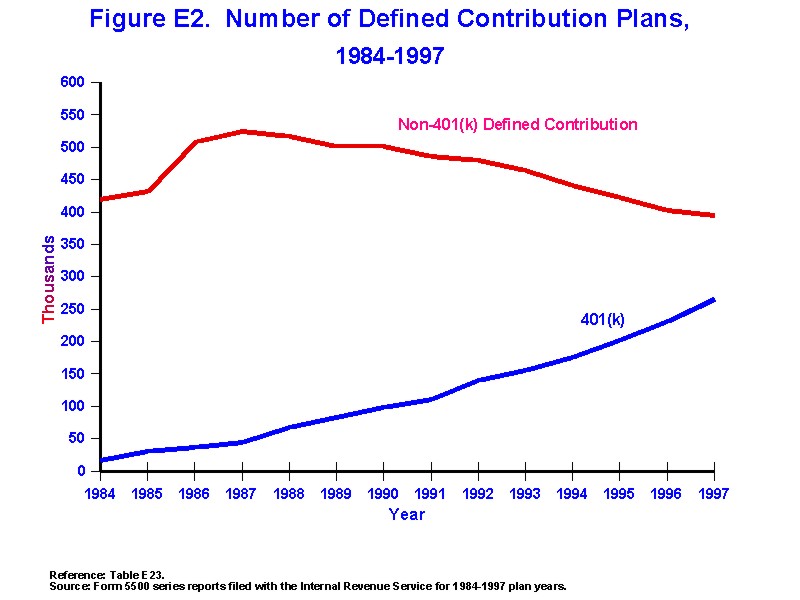
- Figure E2: Number of Defined Contribution Plans 1984-1997
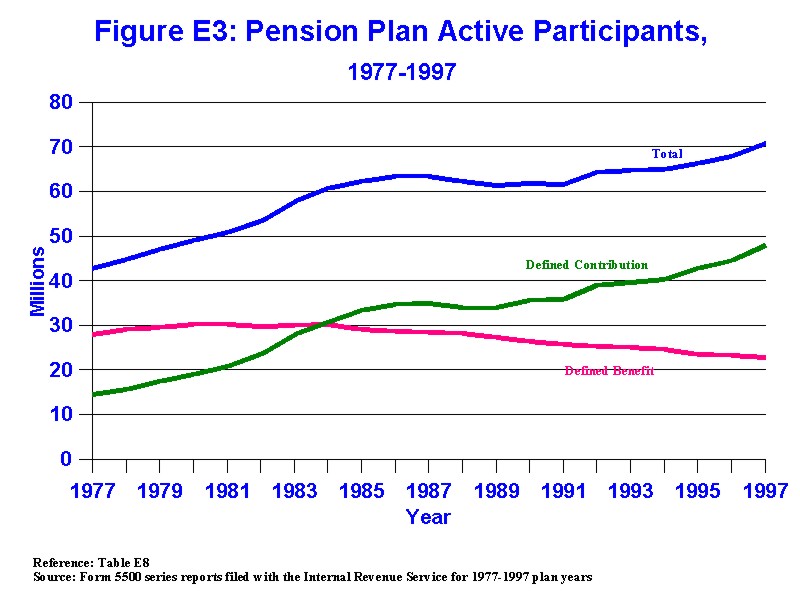
- Figure E3: Pension Plan Active Participants 1978-1997
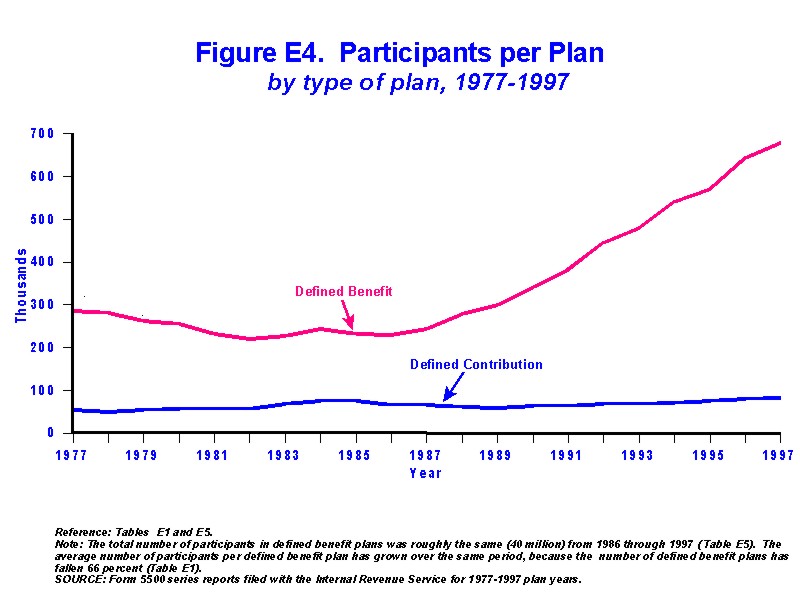
- Figure E4: Participants per Plan by type of plan, 1978-1997
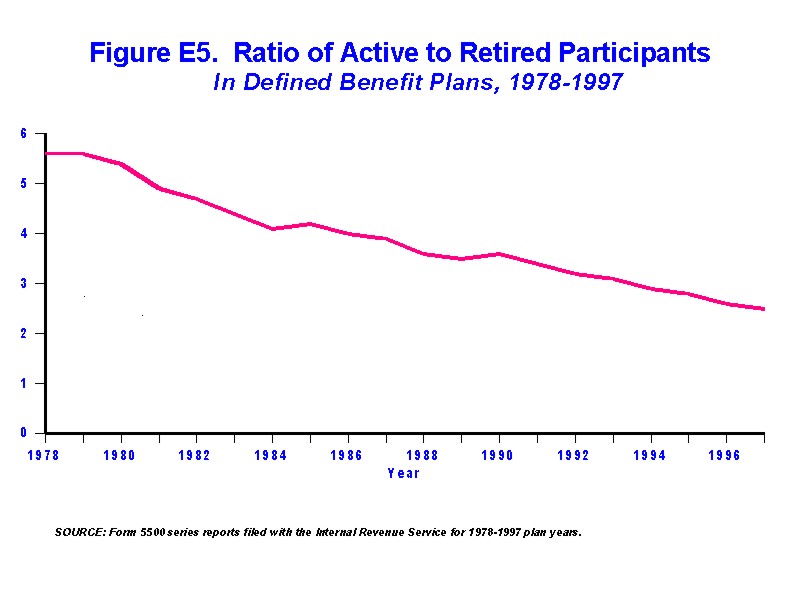
- Figure E5: Ratio of Active to retired Participants in Defined Benefit Plans 1978-1997
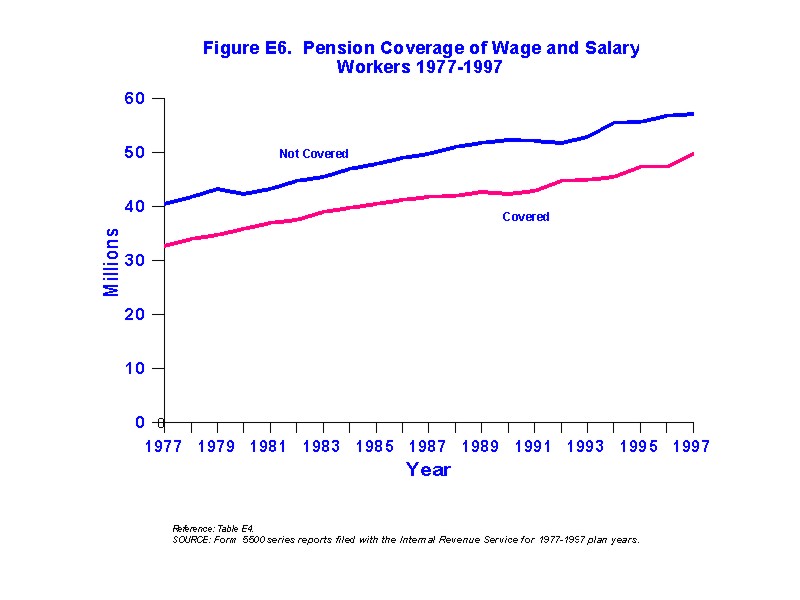
- Figure E6: Pension Coverage of Wage and Salary Workers 1978-1997
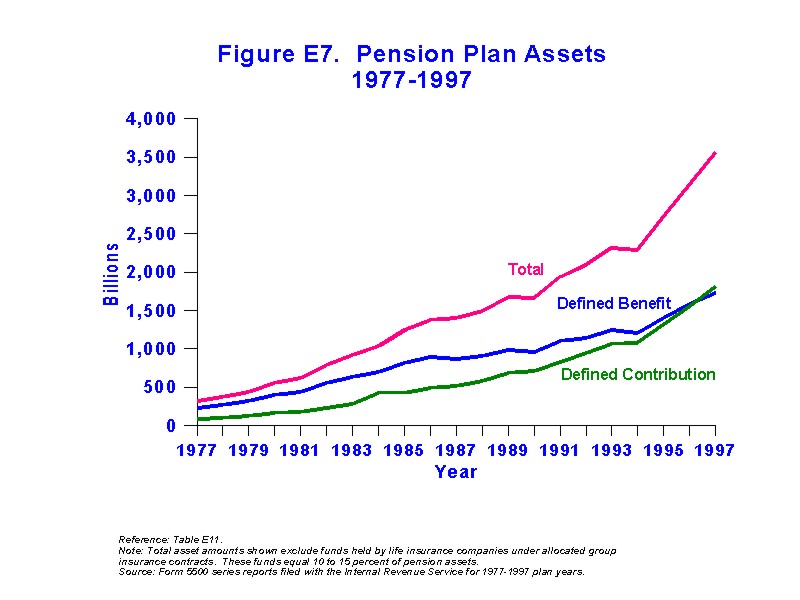
- Figure E7: Pension Plan Assets 1978-1997
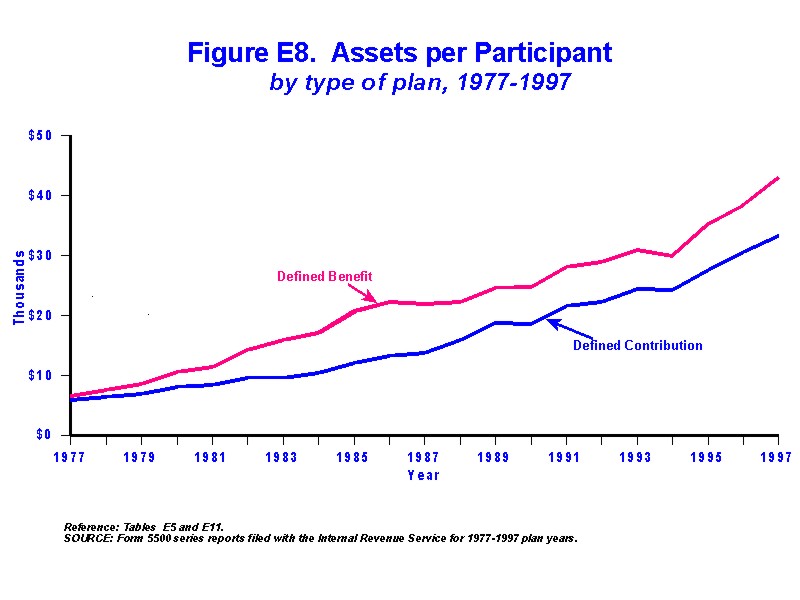
- Figure E8: Assets Per Participant by type of plan, 1978-1997
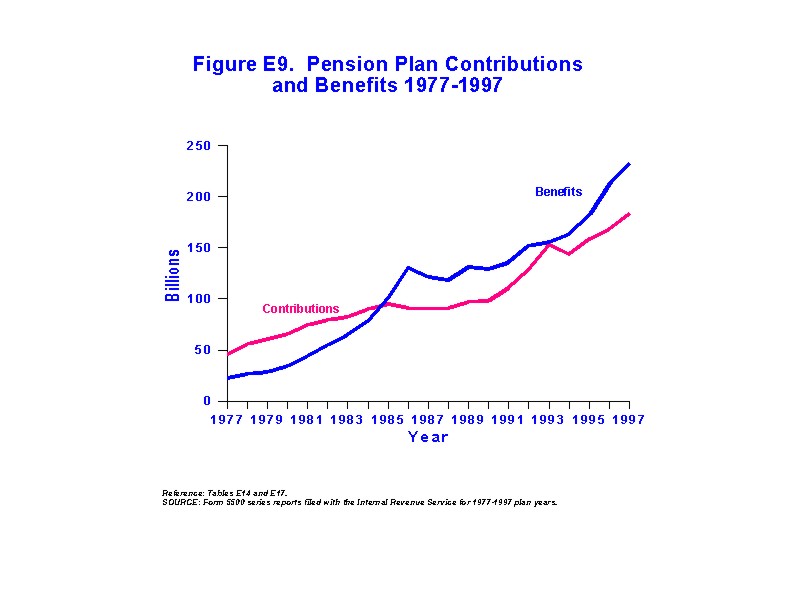
- Figure E9: Pension Plan Contributions and Benefits 1977-1997
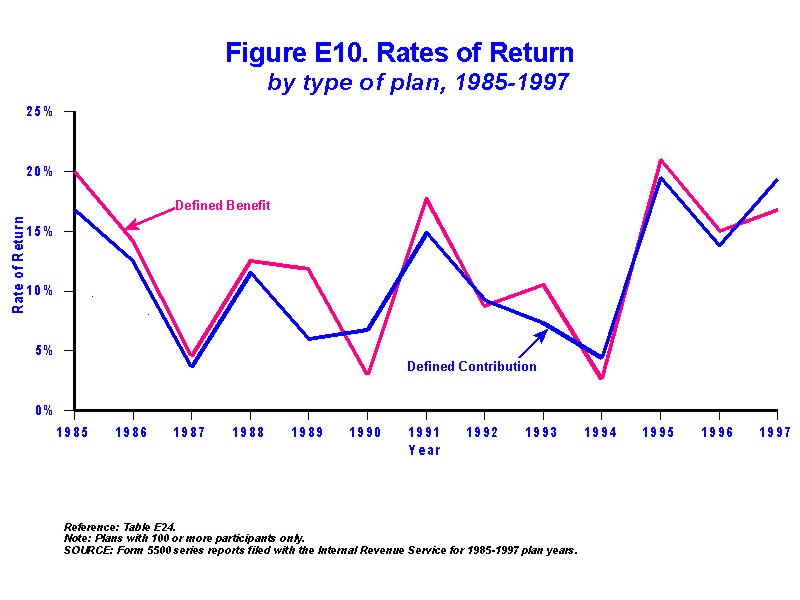
- Figure E10: Rates of Return by type of plan, 1985-1997
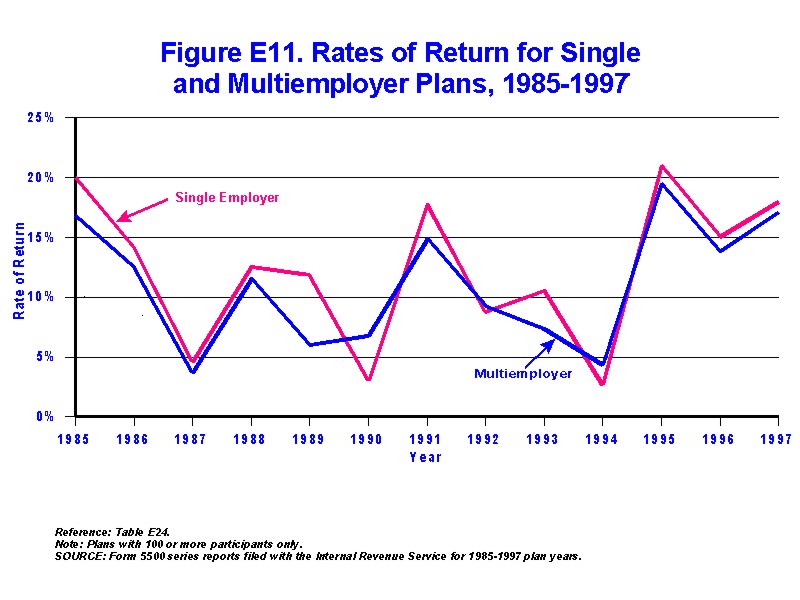
- Figure E11: Rates of Return for Single and Multiemployer Plans 1985-1997
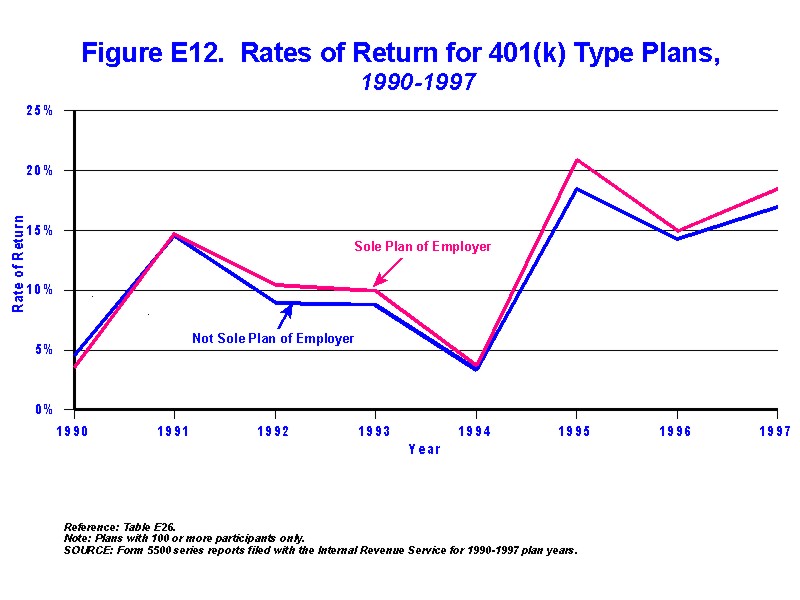
- Figure E12: Rates of Return for 401(k) Type Plans 1990-1997
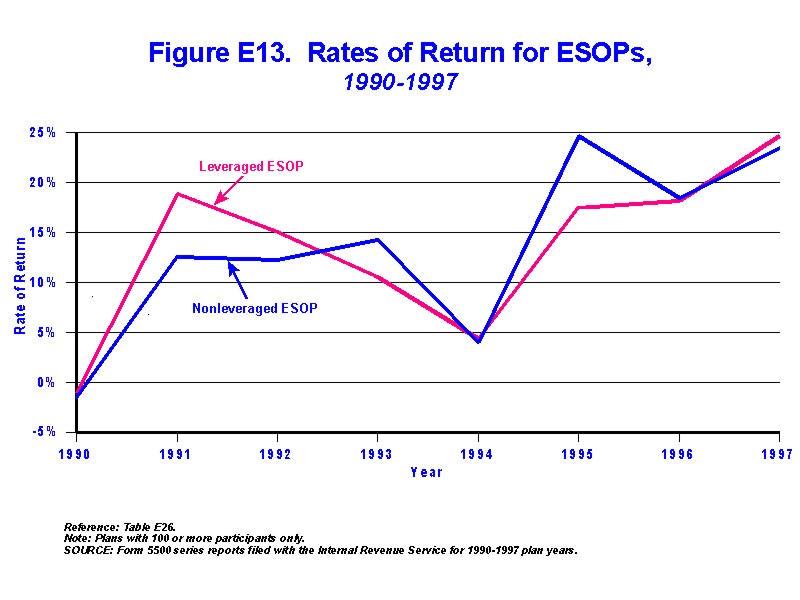
- Figure E13: Rates of Return for ESOPs 1990-1997
Highlights
The number of private pension plans increased 3% in 1997 to 720,000, the largest percentage increase since 1986. The growth in plans resulted from a 15% increase in 401(k) type plans to 265,300. This more than offset a 7% decrease in defined benefit (DB) plans to 59,500 and a 2% decrease in non-401(k) defined contribution plans (DC) to 395,300. About 40% of the decrease in non-401(k) DC plans resulted from conversions of ongoing DC plans to 401(k) status.
The number of active participants in pension plans increased by 4% to 70.7 million in 1997. The overall increase was led by very strong growth in 401(k) plan enrollment, which increased by 10% to 33.9 million. Active participants in non-401(k) DC plans increased 2% to 14.1 million. DB plan active participants decreased 2% in 1997 to 22.7 million. The number of active participants in DB plans has decreased every year since 1984, by an average of about 2% per year.
Assets held by private pension plans in 1997 totaled $3.6 trillion, a 13% increase over 1996. Defined contribution plan assets increased 17% to $1.8 trillion while DB plan assets increased 9% to $1.7 trillion. 1997 was the first year in which DC plan assets exceeded the amount of assets held by DB plans.
Other findings from the Form 5500 series reports filed for 1997 plan years are summarized below:
- While the number of small DB plans has decreased every year since 1986, and the number of medium and large DB plans has decreased every year since 1992, the primary reason for the decrease differs between the two groups. Among small plans filing final reports in 1997, 96% terminated and 4% merged with another plan. Among medium and large plans filing final reports, 34% terminated and 66% merged with another plan.
- DC plans filing a final report in 1997 followed a similar pattern, with 88% of the small plans terminating and 12% merging, compared to 25% of medium and large plans terminating and 75% merging.
- Among pension covered workers in 1997, about 54% were covered only by DC plan(s), 32% were covered by both DB and DC plans, and 14% only by a DB plan.
- About two-thirds of pension covered workers (and about one-third of all private sector workers) participated in a 401(k) type plan in 1997, either as a primary or supplemental plan.
- Most of the increase in the number of 401(k) type plan participants during the mid-1990s has been in firms providing pension coverage only through a 401(k) plan. For example, in 1997 an estimated 49% of 401(k) plan enrollees worked for firms sponsoring only 401(k) plans, an increase from 46% in 1996 and 44% in 1995.This pattern is in contrast to the experience during the 1980s, where much of the growth in 401(k) plan participation resulted from the adoption of 401(k) plans (or conversion of existing DC plans) by medium and large firms to supplement DB plans.
- Seventy-eight percent of 401(k) type plans, covering 83% of the active participants, and holding 83% of the assets, provided for participant direction of investments of either all assets or assets based on employee contributions.
- Among plans with 100 or more participants, DC plans achieved a 19.3% aggregate rate of return (investment earnings and appreciation) in 1997, with additional asset growth arising from a positive cash flow of $9.9 billion (contributions minus benefit payout and administrative expenses). Defined benefit plans had a 16.8% aggregate rate of return in 1997 and a negative cash flow of -$67.8 billion.
- DB plans have experienced a negative cash flow every year since 1985. Compared to DC plans, DB plans are more likely to cover workers in many manufacturing and other mature industries with stagnant employment growth. Aging workforces in many of these industries have led to a declining ratio of active to retired workers, from 5.5 in 1978 to 2.5 in 1997.
- Aided by a $21.1 billion positive cash flow, assets held by 401(k) type plans continued to increase at a more rapid rate (19%) than other types of pension plans. The aggregate rate of return for medium and large 401(k) type plans in 1997 was 18.2%, or slightly higher than the overall average of 17.9% for all pension plans.
- Benefit payments from plans to retirees, survivors, and terminating employees increased by 9% in 1997 to $232.5 billion. Benefits paid out by DC plans increased 16% to $135.3 billion and benefit payments from DB plans increased by less than 1% to $97.2 billion.
- Contributions to DC plans increased by 11% in 1997 to $148.1 billion while DB plan contributions increased 1% to $36.1 billion.
- A major consequence of the shift in the pension system from DB to 401(k) plans has been a parallel shift in the financing of pension benefits from employers to employees. From 1977 to 1997, the percentage of contributions to all plans made by participants increased from 12% to 46%. Among DC plans, the share of total contributions made by participants increased from 29% to 55% over the 1977-97 period.
- Of total employer and employee contributions made to 401(k) plans, 66% were made by employees. For workers participating only in a 401(k), 62% of contributions were made by employees compared to 69% for workers participating in both a 401(k) plan and another plan sponsored by their employer.
- ESOPs, after achieving a rate of return in 1996 (18.4%) that was well above the average for all pension plans (14.9%), attained a 17.0% rate of return in 1997, compared to the 17.9% average for all pension plans.
Section A: Summary
|
Type of Plan |
Number of Plans(1) |
Total Participants |
Active Participants |
Total Assets |
Total Contributions |
Total Benefits |
|---|---|---|---|---|---|---|
|
Total |
720,041 |
94,985 |
70,724 |
$3,553,757 |
$177,940 |
$232,479 |
|
Defined benefit |
59,499 |
40,392 |
22,745 |
1,735,604 |
29,862 |
97,213 |
|
Defined contribution |
660,542 |
54,593 |
47,979 |
1,818,152 |
148,078 |
135,266 |
|
Profit sharing and thrift-savings |
516,342 |
44,342 |
39,191 |
1,513,646 |
127,432 |
112,279 |
|
Stock bonus |
4,410 |
3,612 |
3,075 |
123,090 |
7,790 |
9,184 |
|
Target benefit |
5,860 |
171 |
148 |
6,239 |
345 |
529 |
|
Money purchase |
108,203 |
5,120 |
4,447 |
140,621 |
10,115 |
10,365 |
|
Annuity-403(b)(1) |
15,943 |
97 |
93 |
742 |
104 |
66 |
|
Custodial account-403(b)(7) |
1,425 |
7 |
7 |
166 |
16 |
13 |
|
IRAs or annuities (Code 408) |
1,051 |
27 |
20 |
1,002 |
52 |
87 |
|
Other defined contribution |
7,307 |
1,215 |
999 |
32,647 |
2,224 |
2,742 |
Footnotes
- Excludes plans covering only one participant.
- Includes active, retired, and separated vested participants not yet in pay status. The number of participants also includes double counting of workers in more than one plan.
- Active participants include any workers currently in employment covered by a plan and who are earning or retaining credited service under a plan. Active participants also include nonvested former employees who have not yet incurred a break in service.
- Total asset amounts shown exclude funds held by life insurance companies under allocated group insurance contracts for payment of retirement benefits. These excluded funds make up roughly 10 to 15 percent of total pension fund assets.
- Includes both employer and employee contributions.
- Amounts shown include both benefits paid directly from trust funds and premium payments made by plans to insurance carriers. Amounts exclude benefits paid directly by insurance carriers.
Source: Form 5500 series reports filed with the Internal Revenue Service for plan years beginning in 1997.
|
Type of Participant |
Total Plans Total |
Total Plans Defined Benefit |
Total Plans Defined Contribution |
Single Employer Plans(1) Total |
Single Employer Plans(1) Defined Benefit |
Single Employer Plans(1) Defined Contribution |
Multiemployer Plans(2) Total |
Multiemployer Plans(2) Defined Benefit |
Multiemployer Plans(2) Defined Contribution |
|---|---|---|---|---|---|---|---|---|---|
|
Total participants |
94,985 |
40,392 |
54,593 |
83,881 |
31,678 |
52,204 |
11,103 |
8,714 |
2,389 |
|
Active participants(3) |
70,724 |
22,745 |
47,979 |
64,088 |
18,118 |
45,970 |
6,637 |
4,628 |
2,009 |
|
Fully vested |
50,142 |
15,398 |
34,744 |
45,836 |
12,936 |
32,900 |
4,307 |
2,462 |
1,844 |
|
Partially vested |
8,156 |
267 |
7,889 |
8,054 |
197 |
7,857 |
102 |
70 |
31 |
|
Nonvested |
12,427 |
7,080 |
5,346 |
10,198 |
4,985 |
5,213 |
2,228 |
2,095 |
133 |
|
Retired or separated participants receiving benefits |
9,599 |
8,999 |
600 |
7,266 |
6,695 |
571 |
2,333 |
2,304 |
29 |
|
Separated part. with vested right to benefits |
14,661 |
8,647 |
6,014 |
12,528 |
6,865 |
5,663 |
2,133 |
1,782 |
351 |
Footnotes
- Includes single employer plans, plans of controlled groups of corporations and multiple-employer noncollectively bargained plans.
- Includes multiemployer plans and multiple-employer collectively bargained plans.
- Plans with less than 100 participants are required to provide only the total participant count. For these plans, which cover approximately 10 percent of all participants, the distribution of active, retired, and separated vested participants was assumed to be the same as for larger plans in each column.
Note: Excludes plans covering only one participant.
Source: Form 5500 series reports filed with the Internal Revenue Service for plan years beginning in 1997.
Note: Total asset amounts shown exclude funds held by life insurance companies under allocated group insurance contracts for payment of retirement benefits. These excluded funds make up roughly 10 to 15 percent of total pension fund assets.
Source: Form 5500 series reports filed with the Internal Revenue Service for plan years beginning in 1997.
|
Income and Expenses |
Total |
Defined Benefit |
Defined Contribution |
|---|---|---|---|
|
Income |
|||
|
Contributions received or receivable from: |
|||
|
Employers |
$90,523 |
$28,271 |
$62,252 |
|
Participants |
77,494 |
639 |
76,855 |
|
Others |
8,883 |
866 |
8,017 |
|
Noncash contributions |
1,042 |
86 |
956 |
|
Total contributions |
177,940 |
39,862 |
148,078 |
|
Investment earnings(1) |
54,553 |
27,674 |
26,879 |
|
Net gain (loss) on sale of assets |
59,682 |
35,534 |
24,148 |
|
Other or unspecified income(2) |
438,508 |
197,066 |
241,442 |
|
Total Income |
730,683 |
290,136 |
440,547 |
|
Expenses |
|||
|
Benefit payments and payments to provide benefits: |
|||
|
Direct benefits |
224,040 |
93,120 |
130,920 |
|
Other benefits |
8,439 |
4,093 |
4,346 |
|
Total payments |
232,479 |
97,213 |
135,266 |
|
Total administrative expenses |
9,645 |
6,728 |
2,917 |
|
Other or unspecified expenses |
4,216 |
451 |
3,766 |
|
Total Expenses |
246,341 |
104,391 |
141,949 |
|
Net Income |
484,343 |
185,744 |
298,598 |
Footnotes
- Includes interest earnings, dividends, and rents.
- Includes net gain (loss) from pooled funds, unrealized appreciation (depreciation) of assets, and miscellaneous other income items.
Source: Form 5500 series reports filed with the Internal Revenue Service for plan years beginning in 1997.
|
Method of Funding |
Total Plans Total |
Total Plans Defined Benefit |
Total Plans Defined Contribution |
Single Employer Plans(1) Total |
Single Employer Plans(1) Defined Benefit |
Single Employer Plans(1) Defined Contribution |
Multiemployer Plans(2) Total |
Multiemployer Plans(2) Defined Benefit |
Multiemployer Plans(2) Defined Contribution |
|---|---|---|---|---|---|---|---|---|---|
|
Funding arrangement for investment of assets |
|||||||||
|
Total |
$3,553,757 |
$1,735,604 |
$1,818,152 |
$3,213,304 |
$1,432,788 |
$1,780,516 |
$340,452 |
$302,816 |
$37,636 |
|
Trust |
2,161,885 |
1,017,822 |
1,144,063 |
1,967,094 |
849,456 |
1,117,638 |
194,791 |
168,366 |
26,425 |
|
Insurance |
6,416 |
3,329 |
3,086 |
6,308 |
3,257 |
3,051 |
108 |
73 |
36 |
|
Trust and insurance |
1,385,176 |
714,453 |
670,723 |
1,239,623 |
580,075 |
659,548 |
145,553 |
134,378 |
11,175 |
|
Other |
280 |
0 |
279 |
280 |
0 |
279 |
0 |
0 |
0 |
|
Funding arrangement for payment of benefits |
|||||||||
|
Total |
$3,553,757 |
$1,735,604 |
$1,818,152 |
$3,213,304 |
$1,432,788 |
$1,780,516 |
$340,452 |
$302,816 |
$37,636 |
|
Trust |
2,071,645 |
868,427 |
1,203,218 |
1,930,118 |
743,038 |
1,187,080 |
141,527 |
125,389 |
16,138 |
|
Insurance |
74,859 |
39,097 |
35,762 |
72,855 |
37,571 |
35,284 |
2,004 |
1,526 |
478 |
|
Trust and insurance |
1,395,217 |
826,128 |
569,089 |
1,198,504 |
650,378 |
548,126 |
196,713 |
175,750 |
20,963 |
|
Other |
12,035 |
1,952 |
10,083 |
11,827 |
1,800 |
10,027 |
208 |
152 |
56 |
Footnotes
- Includes single employer plans, plans of controlled groups of corporations, and multiple-employer noncollectively bargained plans.
- Includes multiemployer plans and multiple-employer collectively bargained plans.
Note: Total asset amounts shown exclude funds held by life insurance companies under allocated group insurance contracts for payment of retirement benefits. These excluded funds make up roughly 10 to 15 percent of total pension fund assets.
Source: Form 5500 series reports filed with the Internal Revenue Service for plan years beginning in 1997.
|
Collective Bargaining Status |
Total Plans Number of Plans |
Total Plans Total Participants (thousands) |
Total Plans Total Assets (millions)(1) |
Defined Benefit Number of Plans |
Defined Benefit Total Participants (thousands) |
Defined Benefit Total Assets (millions)(1) |
Defined Contribution Number of Plans |
Defined Contribution Total Participants (thousands) |
Defined Contribution Total Assets (millions)(1) |
|---|---|---|---|---|---|---|---|---|---|
|
Total |
720,041 |
94,985 |
$3,553,757 |
59,499 |
40,392 |
$1,735,604 |
660,542 |
54,593 |
$1,818,152 |
|
Collectively bargained plans |
17,037 |
29,267 |
1,228,112 |
8,245 |
19,873 |
924,403 |
8,792 |
9,393 |
303,709 |
|
Noncollectively bargained plans |
703,005 |
65,718 |
2,325,645 |
51,254 |
20,518 |
811,201 |
651,751 |
45,200 |
1,514,443 |
- Asset amounts shown exclude funds held by life insurance companies under allocated insurance contracts for payment of retirement benefits. These excluded funds make up roughly 10 to 15 percent of total pension fund assets.
Note: Some collectively bargained plans cover nonbargaining unit employees under a separate non-negotiated benefit structure.
Source: Form 5500 series reports filed with the Internal Revenue Service for plan years beginning in 1997.
Section B: Plans and Participants
|
Number of Participants |
Total Plans Total |
Total Plans Defined Benefit |
Total Plans Defined Contribution |
Single Employer Plans(1) Total |
Single Employer Plans(1) Defined Benefit |
Single Employer Plans(1) Defined Contribution |
Multiemployer Plans(2) Total |
Multiemployer Plans(2) Defined Benefit |
Multiemployer Plans(2) Defined Contribution |
|---|---|---|---|---|---|---|---|---|---|
|
Total |
720,041 |
59,499 |
660,542 |
716,912 |
57,720 |
659,192 |
3,130 |
1,779 |
1,351 |
|
None or not reported |
55,433 |
5,719 |
49,714 |
55,365 |
5,673 |
49,691 |
69 |
46 |
23 |
|
2-9 |
312,695 |
20,792 |
291,903 |
312,691 |
20,790 |
291,901 |
4 |
2 |
2 |
|
10-24 |
150,411 |
7,350 |
143,060 |
150,410 |
7,350 |
143,059 |
1 |
- |
1 |
|
25-49 |
83,074 |
4,903 |
78,170 |
83,019 |
4,903 |
78,115 |
55 |
- |
55 |
|
50-99 |
52,085 |
4,882 |
47,202 |
51,863 |
4,802 |
47,061 |
221 |
80 |
141 |
|
100-249 |
32,531 |
4,994 |
27,536 |
32,148 |
4,803 |
27,344 |
383 |
191 |
192 |
|
250-499 |
14,148 |
3,359 |
10,789 |
13,646 |
3,083 |
10,563 |
502 |
276 |
226 |
|
500-999 |
8,366 |
2,648 |
5,718 |
7,759 |
2,298 |
5,461 |
607 |
350 |
257 |
|
1,000-2,499 |
6,172 |
2,431 |
3,741 |
5,539 |
2,052 |
3,487 |
633 |
379 |
254 |
|
2,500-4,999 |
2,496 |
1,077 |
1,419 |
2,194 |
893 |
1,301 |
302 |
184 |
118 |
|
5,000-9,999 |
1,355 |
663 |
692 |
1,184 |
538 |
646 |
171 |
125 |
46 |
|
10,000-19,999 |
687 |
346 |
341 |
591 |
273 |
318 |
96 |
73 |
23 |
|
20,000-49,999 |
415 |
225 |
190 |
365 |
183 |
182 |
50 |
42 |
8 |
|
50,000 or more |
176 |
109 |
67 |
140 |
78 |
62 |
36 |
31 |
5 |
Footnotes
- Includes single employer plans, plans of controlled groups of corporations, and multiple-employer noncollectively bargained plans.
- Includes multiemployer plans and multiple-employer collectively bargained plans.
Note: Excludes plans covering only one participant.
Source: Form 5500 series reports filed with the Internal Revenue Service for plan years beginning in 1997.
|
Amount of Assets |
Total Plans Total |
Total Plans Defined Benefit |
Total Plans Defined Contribution |
Single Employer Plans(1) Total |
Single Employer Plans(1) Defined Benefit |
Single Employer Plans(1) Defined Contribution |
Multiemployer Plans(2) Total |
Multiemployer Plans(2) Defined Benefit |
Multiemployer Plans(2) Defined Contribution |
|---|---|---|---|---|---|---|---|---|---|
|
Total |
720,041 |
59,499 |
660,542 |
716,912 |
57,720 |
659,192 |
3,130 |
1,779 |
1,351 |
|
None or not reported |
87,391 |
15,531 |
71,861 |
87,330 |
15,491 |
71,839 |
62 |
40 |
22 |
|
$1-24K |
37,186 |
706 |
36,480 |
37,150 |
702 |
36,448 |
36 |
4 |
32 |
|
25-49K |
36,316 |
581 |
35,735 |
36,310 |
580 |
35,730 |
6 |
1 |
5 |
|
50-99K |
60,374 |
1,908 |
58,466 |
60,359 |
1,902 |
58,457 |
15 |
6 |
9 |
|
100-249K |
116,451 |
4,616 |
111,835 |
116,404 |
4,610 |
111,794 |
47 |
6 |
41 |
|
250-499K |
114,137 |
6,903 |
107,234 |
114,093 |
6,895 |
107,198 |
44 |
8 |
36 |
|
500-999K |
105,257 |
7,529 |
97,727 |
105,200 |
7,519 |
97,680 |
57 |
10 |
47 |
|
1-2.4M |
91,136 |
7,898 |
83,239 |
90,929 |
7,854 |
83,076 |
207 |
44 |
163 |
|
2.5-4.9M |
33,556 |
3,646 |
29,910 |
33,106 |
3,477 |
29,629 |
450 |
169 |
280 |
|
5-9.9M |
16,675 |
2,651 |
14,024 |
16,328 |
2,488 |
13,840 |
347 |
163 |
184 |
|
10-24.9M |
10,723 |
2,817 |
7,905 |
10,149 |
2,483 |
7,665 |
574 |
334 |
240 |
|
25-49.9M |
4,418 |
1,631 |
2,787 |
3,988 |
1,329 |
2,659 |
430 |
302 |
128 |
|
50-74.9M |
1,753 |
759 |
994 |
1,551 |
612 |
939 |
202 |
147 |
55 |
|
75-99.9M |
914 |
433 |
481 |
781 |
330 |
451 |
133 |
103 |
30 |
|
100-149.9M |
1,008 |
454 |
554 |
874 |
348 |
526 |
134 |
106 |
28 |
|
150-199.9M |
568 |
265 |
303 |
472 |
187 |
285 |
96 |
78 |
18 |
|
200-249.9M |
408 |
222 |
186 |
344 |
169 |
175 |
64 |
53 |
11 |
|
250-499.9M |
769 |
397 |
372 |
656 |
297 |
359 |
113 |
100 |
13 |
|
500-999.9M |
492 |
262 |
230 |
439 |
215 |
224 |
53 |
47 |
6 |
|
1-2.49B |
340 |
188 |
152 |
296 |
146 |
150 |
44 |
42 |
2 |
|
2.5B or more |
169 |
101 |
68 |
153 |
85 |
68 |
16 |
16 |
- |
Footnotes
- Includes single employer plans, plans of controlled groups of corporations and multiple-employer noncollectively bargained plans.
- Includes multiemployer plans and multiple-employer collectively bargained plans.
Note: Excludes plans covering only one participant. The letters K, M, and B denote thousands, millions, and billions, respectively.
Source: Form 5500 series reports filed with the Internal Revenue Service for plan years beginning in 1997.
|
Industry |
Total Plans Total |
Total Plans Defined Benefit |
Total Plans Defined Contribution |
Single Employer Plans(1) Total |
Single Employer Plans(1) Defined Benefit |
Single Employer Plans(1) Defined Contribution |
Multiemployer Plans(2) Total |
Multiemployer Plans(2) Defined Benefit |
Multiemployer Plans(2) Defined Contribution |
|---|---|---|---|---|---|---|---|---|---|
|
Total |
720,041 |
59,499 |
660,542 |
716,912 |
57,720 |
659,192 |
3,130 |
1,779 |
1,351 |
|
Agriculture |
11,840 |
1,178 |
10,663 |
11,830 |
1,171 |
10,660 |
10 |
7 |
3 |
|
Mining |
4,705 |
570 |
4,135 |
4,696 |
564 |
4,132 |
9 |
6 |
3 |
|
Construction |
48,416 |
3,011 |
45,404 |
46,527 |
2,046 |
44,481 |
1,888 |
965 |
923 |
|
Manufacturing |
91,261 |
12,726 |
78,536 |
90,971 |
12,508 |
78,463 |
291 |
218 |
73 |
|
Transportation |
11,283 |
1,020 |
10,263 |
11,028 |
843 |
10,185 |
255 |
177 |
78 |
|
Communications and utilities |
8,673 |
1,588 |
7,085 |
8,660 |
1,582 |
7,078 |
13 |
6 |
7 |
|
Wholesale trade |
50,462 |
3,658 |
46,805 |
50,396 |
3,603 |
46,794 |
66 |
55 |
11 |
|
Retail trade |
48,584 |
2,911 |
45,673 |
48,455 |
2,802 |
45,653 |
129 |
109 |
20 |
|
Finance, insurance and real estate |
55,436 |
5,823 |
49,612 |
55,424 |
5,816 |
49,607 |
12 |
7 |
5 |
|
Services |
334,394 |
17,075 |
317,319 |
333,948 |
16,850 |
317,099 |
445 |
225 |
220 |
|
Tax-exempt organizations |
43,607 |
9,397 |
34,210 |
43,600 |
9,395 |
34,205 |
7 |
2 |
5 |
|
Industry not reported |
11,380 |
542 |
10,838 |
11,376 |
540 |
10,836 |
4 |
2 |
2 |
Footnotes
- Includes single employer plans, plans of controlled groups of corporations and multiple-employer noncollectively bargained plans.
- Includes multiemployer plans and multiple-employer collectively bargained plans.
Note: Excludes plans covering only one participant.
Source: Form 5500 series reports filed with the Internal Revenue Service for plan years beginning in 1997.
|
Number of Participants |
Total Plans Total |
Total Plans Defined Benefit |
Total Plans Defined Contribution |
Single Employer Plans(1) Total |
Single Employer Plans(1) Defined Benefit |
Single Employer Plans(1) Defined Contribution |
Multiemployer Plans(2) Total |
Multiemployer Plans(2) Defined Benefit |
Multiemployer Plans(2) Defined Contribution |
|---|---|---|---|---|---|---|---|---|---|
|
Total |
94,985 |
40,392 |
54,593 |
83,881 |
31,678 |
52,204 |
11,103 |
8,714 |
2,389 |
|
2-9 |
1,417 |
91 |
1,326 |
1,417 |
91 |
1,326 |
0 |
0 |
0 |
|
10-24 |
2,349 |
114 |
2,234 |
2,349 |
114 |
2,234 |
0 |
- |
0 |
|
25-49 |
2,866 |
173 |
2,693 |
2,864 |
173 |
2,691 |
2 |
- |
2 |
|
50-99 |
3,645 |
353 |
3,293 |
3,628 |
347 |
3,282 |
17 |
6 |
11 |
|
100-249 |
5,186 |
827 |
4,360 |
5,120 |
793 |
4,327 |
67 |
34 |
33 |
|
250-499 |
4,932 |
1,189 |
3,743 |
4,745 |
1,086 |
3,659 |
187 |
103 |
84 |
|
500-999 |
5,876 |
1,886 |
3,989 |
5,439 |
1,634 |
3,805 |
437 |
252 |
184 |
|
1,000-2,499 |
9,602 |
3,832 |
5,770 |
8,581 |
3,215 |
5,365 |
1,021 |
617 |
405 |
|
2,500-4,999 |
8,747 |
3,772 |
4,975 |
7,689 |
3,126 |
4,563 |
1,057 |
646 |
412 |
|
5,000-9,999 |
9,526 |
4,645 |
4,880 |
8,351 |
3,775 |
4,576 |
1,174 |
870 |
304 |
|
10,000-19,999 |
9,704 |
4,860 |
4,844 |
8,357 |
3,844 |
4,513 |
1,348 |
1,016 |
331 |
|
20,000-49,999 |
12,680 |
6,768 |
5,912 |
11,125 |
5,486 |
5,639 |
1,555 |
1,282 |
272 |
|
50,000 or more |
18,457 |
11,883 |
6,574 |
14,218 |
7,995 |
6,223 |
4,239 |
3,888 |
351 |
Footnotes
- Includes single employer plans, plans of controlled groups of corporations and multiple-employer noncollectively bargained plans.
- Includes multiemployer plans and multiple-employer collectively bargained plans.
- Less than 500
Source: Form 5500 series reports filed with the Internal Revenue Service for plan years beginning in 1997.
|
Amount of Assets |
Total Plans Total |
Total Plans Defined Benefit |
Total Plans Defined Contribution |
Single Employer Plans(1) Total |
Single Employer Plans(1) Defined Benefit |
Single Employer Plans(1) Defined Contribution |
Multiemployer Plans(2) Total |
Multiemployer Plans(2) Defined Benefit |
Multiemployer Plans(2) Defined Contribution |
|---|---|---|---|---|---|---|---|---|---|
|
Total |
94,985 |
40,392 |
54,593 |
83,881 |
31,678 |
52,204 |
11,103 |
8,714 |
2,389 |
|
None or not reported |
1,963 |
611 |
1,352 |
1,956 |
608 |
1,348 |
7 |
3 |
4 |
|
$1-24K |
320 |
9 |
310 |
316 |
9 |
307 |
4 |
1 |
3 |
|
25-49K |
367 |
6 |
361 |
366 |
6 |
360 |
1 |
0 |
1 |
|
50-99K |
765 |
22 |
744 |
761 |
20 |
741 |
4 |
1 |
3 |
|
100-249K |
1,760 |
67 |
1,692 |
1,753 |
66 |
1,687 |
7 |
1 |
5 |
|
250-499K |
2,263 |
134 |
2,129 |
2,244 |
131 |
2,112 |
20 |
3 |
17 |
|
500-999K |
3,031 |
258 |
2,773 |
3,003 |
254 |
2,749 |
28 |
4 |
24 |
|
1-2.4M |
5,159 |
629 |
4,530 |
5,052 |
613 |
4,439 |
107 |
16 |
91 |
|
2.5-4.9M |
4,493 |
813 |
3,680 |
4,313 |
770 |
3,542 |
180 |
42 |
138 |
|
5-9.9M |
4,658 |
1,118 |
3,540 |
4,387 |
1,031 |
3,355 |
272 |
87 |
184 |
|
10-24.9M |
7,133 |
2,364 |
4,769 |
6,519 |
2,086 |
4,433 |
614 |
278 |
335 |
|
25-49.9M |
6,222 |
2,521 |
3,702 |
5,484 |
2,105 |
3,379 |
738 |
416 |
322 |
|
50-74.9M |
3,976 |
1,743 |
2,233 |
3,548 |
1,480 |
2,068 |
428 |
263 |
165 |
|
75-99.9M |
2,946 |
1,391 |
1,555 |
2,518 |
1,119 |
1,399 |
428 |
272 |
156 |
|
100-149.9M |
3,941 |
1,841 |
2,100 |
3,417 |
1,549 |
1,868 |
524 |
292 |
231 |
|
150-199.9M |
3,248 |
1,418 |
1,830 |
2,586 |
1,006 |
1,580 |
662 |
413 |
249 |
|
200-249.9M |
3,234 |
1,507 |
1,727 |
2,780 |
1,123 |
1,657 |
454 |
384 |
70 |
|
250-499.9M |
7,215 |
3,853 |
3,361 |
6,008 |
2,842 |
3,167 |
1,206 |
1,011 |
195 |
|
500-999.9M |
7,507 |
4,065 |
3,441 |
6,470 |
3,193 |
3,276 |
1,037 |
872 |
165 |
|
1-2.49B |
10,904 |
6,501 |
4,403 |
9,064 |
4,691 |
4,373 |
1,840 |
1,810 |
30 |
|
2.5B or more |
13,879 |
9,518 |
4,361 |
11,337 |
6,976 |
4,361 |
2,543 |
2,543 |
- |
Footnotes
- Includes single employer plans, plans of controlled groups of corporations, and multiple-employer noncollectively bargained plans.
- Includes multiemployer plans and multiple-employer collectively bargained plans.
Notes: Excludes plans covering only one participant. The letters K, M, and B denote thousands, millions, and billions, respectively.
Source: Form 5500 series reports filed with the Internal Revenue Service for plan years beginning in 1997.
|
Industry |
Total Plans Total |
Total Plans Defined Benefit |
Total Plans Defined Contribution |
Single Employer Plans(1) Total |
Single Employer Plans(1) Defined Benefit |
Single Employer Plans(1) Defined Contribution |
Multiemployer Plans(2) Total |
Multiemployer Plans(2) Defined Benefit |
Multiemployer Plans(2) Defined Contribution |
|---|---|---|---|---|---|---|---|---|---|
|
Total |
94,985 |
40,392 |
54,593 |
83,881 |
31,678 |
52,204 |
11,103 |
8,714 |
2,389 |
|
Agriculture |
510 |
185 |
325 |
492 |
169 |
324 |
18 |
16 |
2 |
|
Mining |
980 |
488 |
492 |
833 |
348 |
485 |
148 |
140 |
7 |
|
Construction |
6,035 |
3,108 |
2,927 |
1,671 |
163 |
1,507 |
4,364 |
2,945 |
1,419 |
|
Manufacturing |
34,199 |
16,934 |
17,265 |
32,786 |
15,754 |
17,032 |
1,413 |
1,180 |
233 |
|
Transportation |
4,696 |
2,479 |
2,217 |
3,170 |
1,073 |
2,097 |
1,526 |
1,405 |
120 |
|
Communications and utilities |
4,951 |
2,442 |
2,508 |
4,902 |
2,406 |
2,496 |
49 |
36 |
13 |
|
Wholesale trade |
3,417 |
950 |
2,467 |
3,151 |
714 |
2,437 |
266 |
236 |
29 |
|
Retail trade |
10,161 |
3,509 |
6,652 |
8,714 |
2,208 |
6,506 |
1,446 |
1,301 |
146 |
|
Finance, insurance and real estate |
9,385 |
3,963 |
5,422 |
9,348 |
3,935 |
5,413 |
37 |
28 |
9 |
|
Services |
17,902 |
5,186 |
12,716 |
16,091 |
3,781 |
12,310 |
1,811 |
1,405 |
406 |
|
Tax-exempt organizations |
2,352 |
1,060 |
1,292 |
2,349 |
1,059 |
1,290 |
3 |
1 |
2 |
|
Industry not reported |
397 |
89 |
308 |
374 |
68 |
306 |
23 |
21 |
3 |
Footnotes
- Includes single employer plans, plans of controlled groups of corporations, and multiple-employer noncollectively bargained plans.
- Includes multiemployer plans and multiple-employer collectively bargained plans.
Source: Form 5500 series reports filed with the Internal Revenue Service for plan years beginning in 1997.
|
Type of Plan |
Total Plans |
Single Employer Plans(2) |
Multiemployer Plans(3) |
|---|---|---|---|
|
TOTAL |
70,724 |
64,088 |
6,637 |
|
Defined benefit |
22,745 |
18,118 |
4,628 |
|
Defined contribution |
47,979 |
45,970 |
2,009 |
|
Profit sharing and thrift-savings |
39,191 |
38,829 |
362 |
|
Stock bonus |
3,075 |
3,074 |
0 |
|
Target benefit |
148 |
143 |
5 |
|
Money purchase |
4,447 |
2,966 |
1,481 |
|
Annuity-403(b)(1) |
93 |
84 |
9 |
|
Custodial account-403(b)7 |
7 |
7 |
- |
|
IRAs or annuities (Code 408) |
20 |
17 |
2 |
|
Other defined contribution |
999 |
849 |
150 |
Footnotes
- Active participants include any workers currently in employment covered by a plan and who are earning or retaining credited service under a plan. Active participants also include any nonvested former employees who have not yet incurred a break in service.
- Includes single employer plans, plans of controlled groups of corporations, and multiple-employer noncollectively bargained plans.
- Includes multiemployer plans and multiple-employer collectively bargained plans.
Source: Form 5500 series reports filed with the Internal Revenue Service for plan years beginning in 1997.
|
Method of Funding |
Total Plans Total |
Total Plans Defined Benefit |
Total Plans Defined Contribution |
Single Employer Plans(1) Total |
Single Employer Plans(1) Defined Benefit |
Single Employer Plans(1) Defined Contribution |
Multiemployer Plans(2) Total |
Multiemployer Plans(2) Defined Benefit |
Multiemployer Plans(2) Defined Contribution |
|---|---|---|---|---|---|---|---|---|---|
|
Funding arrangement for investment of assets |
|||||||||
|
Total |
720,041 |
59,499 |
660,542 |
716,912 |
57,720 |
659,192 |
3,130 |
1,779 |
1,351 |
|
Trust |
487,682 |
35,149 |
452,533 |
485,360 |
33,870 |
451,490 |
2,322 |
1,279 |
1,043 |
|
Insurance |
14,114 |
1,684 |
12,430 |
14,095 |
1,673 |
12,422 |
19 |
11 |
8 |
|
Trust and insurance |
168,790 |
12,704 |
156,086 |
168,007 |
12,217 |
155,790 |
783 |
487 |
296 |
|
Other |
49,456 |
9,962 |
39,494 |
49,450 |
9,960 |
39,490 |
6 |
2 |
4 |
|
Funding arrangement for payment of benefits |
|||||||||
|
Total |
720,041 |
59,499 |
660,542 |
716,912 |
57,720 |
659,192 |
3,130 |
1,779 |
1,351 |
|
Trust |
477,940 |
34,614 |
443,325 |
476,654 |
33,912 |
442,742 |
1,285 |
702 |
584 |
|
Insurance |
51,057 |
4,432 |
46,625 |
50,957 |
4,372 |
46,585 |
100 |
60 |
40 |
|
Trust and insurance |
125,798 |
10,226 |
115,571 |
124,089 |
9,235 |
114,853 |
1,709 |
991 |
718 |
|
Other |
65,247 |
10,226 |
55,021 |
65,212 |
10,200 |
55,012 |
35 |
26 |
9 |
Footnotes
- Includes single employer plans, plans of controlled groups of corporations, and multiple-employer noncollectively bargained plans.
- Includes multiemployer plans and multiple-employer collectively bargained plans.
Source: Form 5500 series reports filed with the Internal Revenue Service for plan years beginning in 1997.
|
Method of Funding |
Total Plans Total |
Total Plans Defined Benefit |
Total Plans Defined Contribution |
Single Employer Plans(1) Total |
Single Employer Plans(1) Defined Benefit |
Single Employer Plans(1) Defined Contribution |
Multiemployer Plans(2) Total |
Multiemployer Plans(2) Defined Benefit |
Multiemployer Plans(2) Defined Contribution |
|---|---|---|---|---|---|---|---|---|---|
|
Funding arrangement for investment of assets |
|||||||||
|
Total |
94,985 |
40,392 |
54,593 |
83,881 |
31,678 |
52,204 |
11,103 |
8,714 |
2,389 |
|
Trust |
59,752 |
25,397 |
34,356 |
52,932 |
20,398 |
32,535 |
6,820 |
4,999 |
1,821 |
|
Insurance |
593 |
220 |
373 |
586 |
217 |
369 |
7 |
3 |
3 |
|
Trust and insurance |
33,191 |
14,317 |
18,874 |
28,914 |
10,605 |
18,309 |
4,277 |
3,712 |
565 |
|
Other |
1,449 |
458 |
991 |
1,449 |
458 |
990 |
(3) |
0 |
(3) |
|
Funding arrangement for payment of benefits |
|||||||||
|
Trust |
55,766 |
22,010 |
33,756 |
51,553 |
18,744 |
32,809 |
4,213 |
3,266 |
947 |
|
Insurance |
3,601 |
1,239 |
2,362 |
3,514 |
1,177 |
2,336 |
87 |
61 |
26 |
|
Trust and insurance |
33,919 |
16,658 |
17,261 |
27,122 |
11,273 |
15,849 |
6,797 |
5,384 |
1,413 |
|
Other |
1,699 |
486 |
1,214 |
1,692 |
483 |
1,209 |
7 |
3 |
4 |
Footnotes
- Includes single employer plans, plans of controlled groups of corporations, and multiple-employer noncollectively bargained plans.
- Includes multiemployer plans and multiple-employer collectively bargained plans.
- Less than 500.
Source: Form 5500 series reports filed with the Internal Revenue Service for plan years beginning in 1997.
Source: Form 5500 series reports filed with the Internal Revenue Service for plan years beginning in 1997.
Section C: Financial
|
Number of Participants |
Total Plans Total |
Total Plans Defined Benefit |
Total Plans Defined Contribution |
Single Employer Plans(1) Total |
Single Employer Plans(1) Defined Benefit |
Single Employer Plans(1) Defined Contribution |
Multiemployer Plans(2) Total |
Multiemployer Plans(2) Defined Benefit |
Multiemployer Plans(2) Defined Contribution |
|---|---|---|---|---|---|---|---|---|---|
|
Total |
$3,553,757 |
$1,735,604 |
$1,818,152 |
$3,213,304 |
$1,432,788 |
$1,780,516 |
$340,452 |
$302,816 |
$37,636 |
|
None or not reported |
5,160 |
1,920 |
3,240 |
4,668 |
1,504 |
3,165 |
491 |
416 |
75 |
|
2-9 |
126,236 |
10,225 |
116,011 |
126,236 |
10,225 |
116,011 |
(3) |
(3) |
(3) |
|
10-24 |
94,092 |
3,260 |
90,831 |
94,089 |
3,260 |
90,829 |
2 |
- |
2 |
|
25-49 |
79,758 |
3,280 |
76,478 |
79,616 |
3,280 |
76,336 |
142 |
- |
142 |
|
50-99 |
93,530 |
6,929 |
86,601 |
92,864 |
6,607 |
86,257 |
666 |
322 |
344 |
|
100-249 |
120,590 |
18,917 |
101,673 |
118,414 |
17,553 |
100,860 |
2,176 |
1,364 |
813 |
|
250-499 |
113,379 |
29,617 |
83,762 |
107,362 |
25,198 |
82,165 |
6,017 |
4,419 |
1,597 |
|
500-999 |
142,464 |
51,011 |
91,452 |
127,806 |
39,826 |
87,980 |
14,658 |
11,186 |
3,472 |
|
1,000-2,499 |
263,179 |
116,146 |
147,033 |
228,548 |
89,494 |
139,054 |
34,631 |
26,653 |
7,978 |
|
2,500-4,999 |
280,887 |
134,183 |
146,704 |
245,187 |
106,678 |
138,509 |
35,701 |
27,505 |
8,195 |
|
5,000-9,999 |
362,720 |
182,693 |
180,027 |
323,013 |
148,298 |
174,714 |
39,707 |
34,394 |
5,313 |
|
10,000-19,999 |
403,901 |
210,308 |
193,593 |
358,860 |
169,258 |
189,603 |
45,041 |
41,050 |
3,991 |
|
20,000-49,999 |
580,337 |
312,545 |
267,793 |
531,800 |
268,569 |
263,230 |
48,537 |
43,975 |
4,562 |
|
50,000 or more |
887,524 |
654,571 |
232,953 |
774,841 |
543,038 |
231,802 |
112,683 |
111,532 |
1,151 |
Footnotes
- Includes single employer plans, plans of controlled groups of corporations and multiple-employer noncollectively bargained plans.
- Includes multiemployer plans and multiple-employer collectively bargained plans.
- Less than $500,000.
Source: Form 5500 series reports filed with the Internal Revenue Service for plan years beginning in 1997.
|
Amount of Assets |
Total Plans Total |
Total Plans Defined Benefit |
Total Plans Defined Contribution |
Single Employer Plans(1) Total |
Single Employer Plans(1) Defined Benefit |
Single Employer Plans(1) Defined Contribution |
Multiemployer Plans(2) Total |
Multiemployer Plans(2) Defined Benefit |
Multiemployer Plans(2) Defined Contribution |
|---|---|---|---|---|---|---|---|---|---|
|
Total |
$3,553,757 |
$1,735,604 |
$1,818,152 |
$3,213,304 |
$1,432,788 |
$1,780,516 |
$340,452 |
$302,816 |
$37,636 |
|
1-24K |
481 |
9 |
472 |
481 |
9 |
472 |
(3) |
(3) |
(3) |
|
25-49K |
1,343 |
23 |
1,321 |
1,343 |
23 |
1,320 |
(3) |
(3) |
(3) |
|
50-99K |
4,461 |
146 |
4,315 |
4,460 |
146 |
4,314 |
1 |
(3) |
1 |
|
100-249K |
19,528 |
801 |
18,727 |
19,519 |
800 |
18,719 |
9 |
1 |
8 |
|
250-499K |
41,149 |
2,522 |
38,627 |
41,133 |
2,519 |
38,614 |
16 |
3 |
13 |
|
500-999K |
74,541 |
5,384 |
69,157 |
74,498 |
5,376 |
69,121 |
44 |
8 |
36 |
|
1-2.4M |
140,828 |
12,320 |
128,508 |
140,452 |
12,241 |
128,211 |
376 |
79 |
297 |
|
2.5-4.9M |
116,412 |
13,031 |
103,381 |
114,747 |
12,380 |
102,367 |
1,665 |
651 |
1,014 |
|
5-9.9M |
116,141 |
18,958 |
97,183 |
113,589 |
17,748 |
95,841 |
2,552 |
1,210 |
1,342 |
|
10-24.9M |
165,165 |
45,224 |
119,941 |
155,711 |
39,696 |
116,015 |
9,454 |
5,528 |
3,926 |
|
25-49.9M |
154,642 |
57,493 |
97,149 |
139,191 |
46,693 |
92,498 |
15,450 |
10,800 |
4,651 |
|
50-74.9M |
106,816 |
46,418 |
60,398 |
94,411 |
37,338 |
57,072 |
12,405 |
9,079 |
3,326 |
|
75-99.9M |
79,285 |
37,468 |
41,818 |
67,606 |
28,467 |
39,139 |
11,679 |
9,001 |
2,678 |
|
100-149.9M |
122,363 |
54,970 |
67,393 |
105,961 |
42,087 |
63,874 |
16,402 |
12,883 |
3,519 |
|
150-199.9M |
97,805 |
45,710 |
52,095 |
81,202 |
32,204 |
48,998 |
16,603 |
13,506 |
3,097 |
|
200-249.9M |
90,999 |
49,531 |
41,468 |
76,577 |
37,572 |
39,005 |
14,422 |
11,959 |
2,463 |
|
250-499.9M |
269,862 |
140,544 |
129,319 |
230,527 |
105,848 |
124,679 |
39,335 |
34,696 |
4,639 |
|
500-999.9M |
340,448 |
182,390 |
158,058 |
302,127 |
148,378 |
153,749 |
38,321 |
34,013 |
4,309 |
|
1-2.49B |
521,952 |
288,558 |
233,395 |
459,820 |
228,742 |
231,078 |
62,132 |
59,815 |
2,317 |
|
2.5B or more |
1,089,534 |
734,106 |
355,428 |
989,950 |
634,522 |
355,428 |
99,585 |
99,585 |
- |
Footnotes
- Includes single employer plans, plans of controlled groups of corporations and multiple-employer noncollectively bargained plans.
- Includes multiemployer plans and multiple-employer collectively bargained plans.
- Less than $500,000.
Note: Excludes plans covering only one participant. The letters K,M, and B denote thousands, millions, and billions, respectively.
Source: Form 5500 series reports filed with the Internal Revenue Service for plan years beginning in 1997.
|
Industry |
Total Plans Total |
Total Plans Defined Benefit |
Total Plans Defined Contribution |
Single Employer Plans(1) Total |
Single Employer Plans(1) Defined Benefit |
Single Employer Plans(1) Defined Contribution |
Multiemployer Plans(2) Total |
Multiemployer Plans(2) Defined Benefit |
Multiemployer Plans(2) Defined Contribution |
|---|---|---|---|---|---|---|---|---|---|
|
TOTAL |
$3,553,757 |
$1,735,604 |
$1,818,152 |
$3,213,304 |
$1,432,788 |
$1,780,516 |
$340,452 |
$302,816 |
$37,636 |
|
Agriculture |
11,126 |
3,764 |
7,363 |
10,914 |
3,559 |
7,356 |
212 |
205 |
7 |
|
Mining |
43,630 |
21,200 |
22,430 |
35,962 |
13,706 |
22,256 |
7,668 |
7,494 |
174 |
|
Construction |
206,369 |
138,528 |
67,841 |
44,898 |
4,787 |
40,111 |
161,472 |
133,742 |
27,730 |
|
Manufacturing |
1,520,959 |
810,731 |
710,228 |
1,496,727 |
787,666 |
709,061 |
24,232 |
23,066 |
1,167 |
|
Transportation |
174,301 |
116,674 |
57,628 |
104,754 |
49,742 |
55,012 |
69,548 |
66,932 |
2,616 |
|
Communications and utilities |
354,330 |
233,257 |
121,073 |
352,376 |
231,391 |
120,986 |
1,954 |
1,866 |
87 |
|
Wholesale trade |
98,902 |
23,830 |
75,072 |
94,870 |
19,926 |
74,944 |
4,032 |
3,904 |
128 |
|
Retail trade |
148,892 |
51,250 |
97,643 |
123,255 |
26,118 |
97,137 |
25,638 |
25,132 |
506 |
|
Finance, insurance, and real estate |
392,645 |
155,356 |
237,289 |
391,873 |
154,679 |
237,193 |
772 |
677 |
95 |
|
Services |
535,008 |
143,557 |
391,451 |
491,322 |
104,948 |
386,374 |
43,686 |
38,609 |
5,077 |
|
Tax-exempt organizations |
60,799 |
34,846 |
25,953 |
60,749 |
34,829 |
25,920 |
50 |
17 |
32 |
|
Industry not reported |
6,794 |
2,611 |
4,183 |
5,604 |
1,438 |
4,166 |
1,189 |
1,173 |
17 |
Footnotes
- Includes single employer plans, plans of controlled groups of corporations and multiple-employer noncollectively bargained plans.
- Includes multiemployer plans and multiple-employer collectively bargained plans.
Source: Form 5500 series reports filed with the Internal Revenue Service for plan years beginning in 1997.
Footnotes
Source: Form 5500 series reports filed with the Internal Revenue Service for plan years beginning in 1997.
|
Type of Asset or Liability |
Total |
Defined Beneft |
Defined Contribution |
|---|---|---|---|
|
Assets |
|||
|
Receivables |
|||
|
Employer contributions |
$20,994 |
$7,701 |
$13,293 |
|
Participant contributions |
1,799 |
124 |
1,675 |
|
Income receivables |
3,898 |
2,380 |
1,518 |
|
Other receivables |
17,326 |
12,383 |
4,943 |
|
Less allowance for doubtful accounts |
11 |
4 |
7 |
|
Total receivables (net) |
44,006 |
22,582 |
21,423 |
|
General Investments |
|||
|
Interest-bearing cash |
52,495 |
21,856 |
30,640 |
|
Certificates of deposit |
2,904 |
1,108 |
1,796 |
|
U.S. Government securities |
81,908 |
63,063 |
18,845 |
|
Corporate debt instruments: Preferred |
23,851 |
14,078 |
9,773 |
|
Corporate debt instruments: All other |
48,489 |
37,763 |
10,726 |
|
Preferred stock |
18,343 |
3,764 |
14,580 |
|
Common stock |
323,971 |
218,246 |
105,725 |
|
Partnership/joint venture interests |
13,717 |
12,931 |
785 |
|
Income-producing real estate |
2,867 |
2,361 |
506 |
|
Nonincome-producing real estate |
2,387 |
2,319 |
68 |
|
Residential loans (other than to participants) secured by mortgages |
2,154 |
1,687 |
467 |
|
Commercial loans secured by mortgages |
1,049 |
844 |
206 |
|
Mortgage loans to participants |
785 |
10 |
775 |
|
Other loans to participants |
22,991 |
595 |
22,396 |
|
Other loans |
1,552 |
335 |
1,217 |
|
Value of interest in common/collective trusts |
176,973 |
75,987 |
100,986 |
|
Value of interest in pooled separate accounts |
92,392 |
41,650 |
50,743 |
|
Value of interest in master trusts |
1,083,122 |
774,396 |
308,726 |
|
Value of interest in 103-12 investment entities |
4,510 |
2,323 |
2,187 |
|
Value of interest in registered investment companies |
394,868 |
56,000 |
338,868 |
|
Value of funds held in insurance company general account |
96,029 |
20,383 |
75,647 |
|
Other or unspecified general investments |
72,145 |
27,156 |
44,989 |
|
Total general investments |
2,519,503 |
1,378,852 |
1,140,651 |
|
Employer securities |
247,918 |
4,905 |
243,014 |
|
Employer real property |
535 |
57 |
477 |
|
Unspecified investments |
356 |
40 |
317 |
|
Total noninterest-bearing cash |
3,492 |
1,471 |
2,021 |
|
Buildings and other property used in plan operations |
21 |
5 |
16 |
|
Total Assets |
2,815,831 |
1,407,912 |
1,407,919 |
|
Liabilities |
|||
|
Benefit claims payable |
4,750 |
547 |
4,203 |
|
Operating payables |
8,827 |
6,908 |
1,919 |
|
Acquisition indebtedness |
14,275 |
1,157 |
13,118 |
|
Other liabilities |
29,171 |
13,799 |
15,372 |
|
Total Liabilities |
57,024 |
22,412 |
34,612 |
|
Net Assets |
2,758,807 |
1,385,501 |
1,373,307 |
Footnotes
- Includes single employer plans, plans of controlled groups of corporations and multiple-employer noncollectively bargained plans.
Source: Form 5500 series reports filed with the Internal Revenue Service for plan years beginning in 1997.
|
Type of Asset or Liability |
Total |
Defined Benefit |
Defined Contribution |
|---|---|---|---|
|
Assets |
|||
|
Receivables |
|||
|
Employer contributions |
$1,612 |
$1,340 |
$272 |
|
Participant contributions |
17 |
6 |
11 |
|
Income receivables |
1,519 |
1,340 |
180 |
|
Other receivables |
2,001 |
1,804 |
197 |
|
Less allowance for doubtful accounts |
121 |
118 |
3 |
|
Total receivables (net) |
5,028 |
4,371 |
657 |
|
General Investments |
|||
|
Interest-bearing cash |
12,198 |
10,371 |
1,827 |
|
Certificates of deposit |
935 |
294 |
641 |
|
U.S. Government securities |
63,759 |
55,557 |
8,203 |
|
Corporate debt instruments: Preferred |
19,359 |
18,195 |
1,163 |
|
Corporate debt instruments: All other |
24,568 |
21,735 |
2,834 |
|
Preferred stock |
499 |
475 |
24 |
|
Common stock |
118,880 |
112,341 |
6,540 |
|
Partnership/joint venture interests |
1,149 |
1,066 |
83 |
|
Income-producing real estate |
3,813 |
3,710 |
103 |
|
Nonincome-producing real estate |
291 |
274 |
17 |
|
Residential loans (other than to participants) secured by mortgages |
544 |
473 |
70 |
|
Commercial loans secured by mortgages |
2,115 |
2,045 |
70 |
|
Mortgage loans to participants |
98 |
87 |
12 |
|
Other loans to participants |
317 |
33 |
285 |
|
Other loans |
549 |
515 |
34 |
|
Value of interest in common/collective trusts |
39,500 |
36,126 |
3,374 |
|
Value of interest in pooled separate accounts |
5,602 |
4,714 |
888 |
|
Value of interest in master trusts |
961 |
605 |
356 |
|
Value of interest in 103-12 investment entities |
1,783 |
1,038 |
745 |
|
Value of interest in registered investment companies |
13,564 |
10,021 |
3,543 |
|
Value of funds held in insurance company general account |
8,401 |
5,616 |
2,785 |
|
Other or unspecified general investments |
13,734 |
11,102 |
2,632 |
|
Total general investments |
332,622 |
296,392 |
36,230 |
|
Employer securities |
688 |
685 |
3 |
|
Employer real property |
4 |
4 |
(2) |
|
Unspecified investments |
84 |
(2) |
84 |
|
Total noninterest-bearing cash |
462 |
371 |
92 |
|
Buildings and other property used in plan operations |
262 |
255 |
7 |
|
Total Assets |
339,151 |
302,078 |
37,072 |
|
Liabilities |
|||
|
Benefit claims payable |
214 |
94 |
120 |
|
Operating payables |
777 |
727 |
50 |
|
Acquisition indebtedness |
316 |
313 |
3 |
|
Other liabilities |
2,647 |
2,480 |
166 |
|
Total Liabilities |
3,953 |
3,614 |
339 |
|
Net Assets |
335,198 |
298,464 |
36,734 |
Footnotes
- Includes multiemployer plans and multiple-employer collectively bargained plans.
- Less than $500,000.
Source: Form 5500 series reports filed with the Internal Revenue Service for plan years beginning in 1997.
|
Type of Asset |
Total |
$1-.9M |
$1.0M-9.9M |
$10.0M-249.9M |
$250.0M-999.9M |
$1.0B or more |
|---|---|---|---|---|---|---|
|
Total Assets |
100 |
100 |
100 |
100 |
100 |
100 |
|
Cash |
2 |
9 |
5 |
2 |
2 |
2 |
|
Receivables |
2 |
8 |
3 |
2 |
1 |
2 |
|
U.S. Government securities |
7 |
5 |
8 |
10 |
8 |
6 |
|
Corporate debt instruments: Preferred |
2 |
6 |
2 |
2 |
2 |
2 |
|
Corporate debt instruments: All other |
3 |
2 |
3 |
4 |
4 |
3 |
|
Corporate stocks |
20 |
5 |
14 |
22 |
20 |
19 |
|
Real estate and mortgages (other than to participants) |
1 |
(1) |
(1) |
(1) |
1 |
1 |
|
Other loans to participants |
(1) |
(1) |
(1) |
(1) |
(1) |
(1) |
|
Value of interest in common/collective trusts |
7 |
8 |
9 |
8 |
6 |
6 |
|
Value of interest in pooled separate accounts |
3 |
6 |
9 |
4 |
2 |
2 |
|
Value of interest in master trusts |
45 |
20 |
20 |
32 |
45 |
50 |
|
Value of interest in registered investment companies |
4 |
13 |
14 |
8 |
4 |
2 |
|
Value of funds held in insurance company general account |
2 |
14 |
9 |
3 |
1 |
1 |
|
Employer securities |
(1) |
(1) |
(1) |
(1) |
(1) |
(1) |
|
Other investments |
3 |
5 |
4 |
3 |
3 |
3 |
Footnotes
- Less than one percent.
Note: The letters M and B in the column headings denote millions and billions, respectively. Percentage distribution may not add up to 100 because of rounding.
Source: Form 5500 series reports filed with the Internal Revenue Service for plan years beginning in 1997.
|
Type of Asset |
Total |
$1-.9M |
$1.0M-9.9M |
$10.0M-249.9M |
$250.0M-999.9M |
$1.0B or more |
|---|---|---|---|---|---|---|
|
Total Assets |
100 |
100 |
100 |
100 |
100 |
100 |
|
Cash |
3 |
5 |
5 |
4 |
2 |
1 |
|
Receivables |
2 |
5 |
3 |
2 |
2 |
1 |
|
U.S. Government securities |
2 |
1 |
2 |
3 |
2 |
1 |
|
Corporate debt instruments: Preferred |
1 |
2 |
3 |
1 |
(1) |
1 |
|
Corporate debt instruments: All other |
1 |
1 |
1 |
1 |
1 |
1 |
|
Corporate stocks |
9 |
3 |
6 |
8 |
9 |
10 |
|
Real estate and mortgages (other than to participants) |
(1) |
(1) |
(1) |
(1) |
(1) |
(1) |
|
Other loans to participants |
2 |
1 |
2 |
2 |
2 |
1 |
|
Value of interest in common/collective trusts |
7 |
5 |
7 |
9 |
7 |
6 |
|
Value of interest in pooled separate accounts |
4 |
23 |
16 |
5 |
1 |
1 |
|
Value of interest in master trusts |
21 |
1 |
2 |
10 |
23 |
33 |
|
Value of interest in registered investment companies |
24 |
27 |
34 |
36 |
24 |
12 |
|
Value of funds held in insurance company general account |
5 |
8 |
8 |
5 |
5 |
5 |
|
Employer securities |
17 |
2 |
4 |
10 |
19 |
24 |
|
Other investments |
4 |
14 |
8 |
4 |
4 |
3 |
Footnotes
- Less than one percent.
Note: The letters M and B in the column headings denote millions and billions, respectively. Percentage distribution may not add up to 100 because of rounding.
Source: Form 5500 series reports filed with the Internal Revenue Service for plan years beginning in 1997.
|
Income and Expenses |
Total |
Defined Benefit |
Defined Contribution |
|---|---|---|---|
|
Income |
|||
|
Contributions received or receivable from: |
|||
|
Employers |
$69,221 |
$26,361 |
$42,859 |
|
Participants |
67,443 |
617 |
66,826 |
|
Other administrative expenses |
6,024 |
822 |
5,202 |
|
Noncash contributions |
969 |
86 |
883 |
|
Total contributions |
143,655 |
27,886 |
115,770 |
|
Interest earnings: |
|||
|
Interest-bearing cash |
6,464 |
2,646 |
3,819 |
|
Certificates of deposit |
258 |
109 |
149 |
|
Other administrative expenses |
8,196 |
6,604 |
1,592 |
|
Corporate debt instruments |
6,160 |
5,086 |
1,074 |
|
Mortgage loans |
405 |
319 |
85 |
|
Other loans |
1,279 |
52 |
1,226 |
|
Other or unspecified interest |
13,223 |
5,733 |
7,491 |
|
Total interest earnings |
35,985 |
20,549 |
15,436 |
|
Dividends: |
|||
|
Preferred stock |
1,869 |
281 |
1,588 |
|
Common stock |
15,648 |
6,331 |
9,317 |
|
Total dividend income |
17,517 |
6,612 |
10,906 |
|
Rents |
360 |
287 |
72 |
|
Net gain (loss) on sale of assets |
51,788 |
34,872 |
16,916 |
|
Unrealized appreciation (depreciation) of assets |
122,825 |
42,853 |
79,972 |
|
Net investment gain (loss) from common/collective trusts |
25,481 |
12,475 |
13,006 |
|
Net investment gain (loss) from pooled separate accounts |
14,459 |
6,562 |
7,896 |
|
Net investment gain (loss) from master trusts |
166,439 |
120,737 |
45,702 |
|
Net investment gain (loss) from 103-12 investment entities |
929 |
499 |
430 |
|
Net investment gain (loss) from registered investment companies |
47,355 |
5,460 |
41,895 |
|
Other or unspecified income |
8,320 |
3,137 |
5,183 |
|
Total Income |
635,113 |
281,931 |
353,183 |
|
Expenses |
|||
|
Benefit payments and payments to provide benefits: |
|||
|
Direct benefits |
184,868 |
86,385 |
98,483 |
|
Payments to insurance carriers |
2,992 |
2,650 |
342 |
|
Other benefits |
1,554 |
459 |
1,096 |
|
Total payments |
189,413 |
89,493 |
99,920 |
|
Interest expense |
2,109 |
10 |
2,099 |
|
Administrative expenses: |
|||
|
Salaries and allowances |
277 |
214 |
63 |
|
Accounting fees |
136 |
89 |
47 |
|
Actuarial fees |
418 |
401 |
17 |
|
Contract administrator fees |
617 |
440 |
177 |
|
Investment advisory and management fees |
3,614 |
3,046 |
569 |
|
Legal fees |
160 |
131 |
29 |
|
Valuation/appraisal fees |
16 |
8 |
8 |
|
Trustee fees/expenses |
653 |
412 |
240 |
|
Other administrative expenses |
2,340 |
1,745 |
596 |
|
Total administrative expenses |
8,231 |
6,486 |
1,745 |
|
Other or unspecified expenses |
9 |
(1) |
9 |
|
Total Expenses |
199,762 |
95,989 |
103,773 |
|
Net Income |
435,352 |
185,941 |
249,410 |
Footnotes
- Less than $500,000.
Source: Form 5500 series reports filed with the Internal Revenue Service for plan years beginning in 1997.
|
Income and Expenses |
Total |
Defined Benefit |
Defined Contribution |
|---|---|---|---|
|
Income |
|||
|
Contributions received or receivable from: |
|||
|
Employers |
$56,328 |
$16,352 |
$39,976 |
|
Participants |
67,138 |
547 |
66,591 |
|
Others |
5,995 |
804 |
5,191 |
|
Noncash contributions |
969 |
86 |
883 |
|
Total contributions |
139,429 |
17,788 |
112,641 |
|
Interest earnings: |
|||
|
Interest-bearing cash |
5,571 |
1,864 |
3,707 |
|
Certificates of deposit |
188 |
86 |
102 |
|
U.S. Government securities |
4,325 |
3,240 |
1,084 |
|
Corporate debt instruments |
3,556 |
2,709 |
846 |
|
Mortgage loans |
212 |
141 |
70 |
|
Other loans |
1,243 |
37 |
1,206 |
|
Other or unspecified interest |
11,570 |
4,370 |
7,201 |
|
Total interest earnings |
26,665 |
12,448 |
14,217 |
|
Dividends: |
|||
|
Preferred stock |
1,792 |
210 |
1,582 |
|
Common stock |
13,628 |
4,460 |
9,168 |
|
Total dividend income |
15,421 |
4,671 |
10,751 |
|
Rents |
181 |
113 |
68 |
|
Net gain (loss) on sale of assets |
38,573 |
22,379 |
16,194 |
|
Unrealized appreciation (depreciation) of assets |
104,679 |
25,935 |
78,744 |
|
Net investment gain (loss) from common/collective trusts |
20,751 |
8,061 |
12,690 |
|
Net investment gain (loss) from pooled separate accounts |
13,797 |
5,997 |
7,799 |
|
Net investment gain (loss) from master trusts |
166,312 |
120,641 |
45,671 |
|
Net investment gain (loss) from 103-12 investment entities |
698 |
362 |
336 |
|
Net investment gain (loss) from registered investment companies |
46,225 |
4,702 |
41,522 |
|
Other or unspecified income |
7,875 |
2,730 |
5,145 |
|
Total Income |
571,605 |
225,826 |
345,779 |
|
Expenses |
|||
|
Benefit payments and payments to provide benefits: |
|||
|
Direct benefits |
168,022 |
71,475 |
96,547 |
|
Payments to insurance carriers |
1,784 |
1,481 |
304 |
|
Other benefits |
1,507 |
431 |
1,076 |
|
Total payments |
171,312 |
73,386 |
97,926 |
|
Interest expense |
2,104 |
6 |
2,098 |
|
Administrative expenses: |
|||
|
Salaries and allowances |
92 |
43 |
48 |
|
Accounting fees |
87 |
51 |
36 |
|
Actuarial fees |
352 |
339 |
13 |
|
Contract administrator fees |
441 |
289 |
152 |
|
Investment advisory and management fees |
2,627 |
2,148 |
479 |
|
Legal fees |
56 |
40 |
16 |
|
Valuation/appraisal fees |
14 |
6 |
8 |
|
Trustee fees/expenses |
629 |
392 |
237 |
|
Other administrative expenses |
1,975 |
1,429 |
545 |
|
Total administrative expenses |
6,271 |
4,738 |
1,533 |
|
Other or unspecified expenses |
9 |
(1) |
9 |
|
Total Expenses |
179,696 |
78,131 |
101,566 |
|
Net Income |
391,909 |
147,696 |
244,213 |
Footnotes
- Less than $500,000.
Source: Form 5500 series reports filed with the Internal Revenue Service for plan years beginning in 1997.
|
Income and Expenses |
Total |
Defined Benefit |
Defined Contribution |
|---|---|---|---|
|
Income |
|||
|
Contributions received or receivable from: |
|||
|
Employers |
$12,892 |
$10,009 |
$2,883 |
|
Participants |
305 |
70 |
235 |
|
Others |
28 |
18 |
10 |
|
Noncash contributions |
(1) |
(1) |
(1) |
|
Total contributions |
13,226 |
10,097 |
3,128 |
|
Interest earnings: |
|||
|
Interest-bearing cash |
893 |
782 |
111 |
|
Certificates of deposit |
70 |
23 |
47 |
|
U.S. Government securities |
3,872 |
3,364 |
508 |
|
Corporate debt instruments |
2,604 |
2,377 |
227 |
|
Mortgage loans |
193 |
178 |
15 |
|
Other loans |
36 |
15 |
21 |
|
Other or unspecified interest |
1,653 |
1,363 |
290 |
|
Total interest earnings |
9,321 |
8,102 |
1,219 |
|
Dividends: |
|||
|
Preferred stock |
77 |
71 |
6 |
|
Common stock |
2,020 |
1,871 |
149 |
|
Total dividend income |
2,096 |
1,941 |
155 |
|
Rents |
179 |
174 |
4 |
|
Net gain (loss) on sale of assets |
13,215 |
12,493 |
722 |
|
Unrealized appreciation (depreciation) of assets |
18,146 |
16,918 |
1,228 |
|
Net investment gain (loss) from common/collective trusts |
4,730 |
4,415 |
315 |
|
Net investment gain (loss) from pooled separate accounts |
662 |
565 |
97 |
|
Net investment gain (loss) from master trusts |
127 |
96 |
31 |
|
Net investment gain (loss) from 103-12 investment entities |
231 |
137 |
94 |
|
Net investment gain (loss) from registered investment companies |
1,130 |
758 |
372 |
|
Other or unspecified income |
445 |
408 |
38 |
|
Total Income |
63,508 |
56,104 |
7,404 |
|
Expenses |
|||
|
Benefit payments and payments to provide benefits: |
|||
|
Direct benefits |
16,846 |
14,910 |
1,936 |
|
Payments to insurance carriers |
1,207 |
1,169 |
38 |
|
Other benefits |
48 |
28 |
20 |
|
Total payments |
18,101 |
16,107 |
1,994 |
|
Interest expense |
5 |
4 |
1 |
|
Administrative expenses: |
|||
|
Salaries and allowances |
186 |
171 |
15 |
|
Accounting fees |
50 |
39 |
11 |
|
Actuarial fees |
66 |
62 |
3 |
|
Contract administrator fees |
176 |
151 |
25 |
|
Investment advisory and management fees |
987 |
898 |
90 |
|
Legal fees |
104 |
91 |
14 |
|
Valuation/appraisal fees |
2 |
2 |
(1) |
|
Trustee fees/expenses |
24 |
20 |
4 |
|
Other administrative expenses |
365 |
315 |
50 |
|
Total administrative expenses |
1,960 |
1,748 |
212 |
|
Total Expenses |
20,065 |
17,859 |
2,207 |
|
Net Income |
43,443 |
38,246 |
5,197 |
Footnotes
- Less than $500,000.
Source: Form 5500 series reports filed with the Internal Revenue Service for plan years beginning in 1997.
|
Income and Expenses |
Total |
$1-.9M |
$1.0M-9.9M |
$10.0M-249.9M |
$250.0M-999.9M |
$1.0B or More |
|---|---|---|---|---|---|---|
|
Total Income |
100 |
100 |
100 |
100 |
100 |
100 |
|
Contributions received or receivable from: |
||||||
|
Employers |
9 |
56 |
28 |
15 |
11 |
6 |
|
Participants |
(1) |
(1) |
(1) |
(1) |
(1) |
(1) |
|
Others |
(1) |
1 |
(1) |
1 |
(1) |
(1) |
|
Total contributions |
10 |
58 |
28 |
16 |
11 |
7 |
|
Interest earnings: |
||||||
|
Interest-bearing cash |
1 |
2 |
2 |
1 |
1 |
1 |
|
Certificates of deposit |
(1) |
(1) |
(1) |
(1) |
(1) |
(1) |
|
U.S. Government securities |
2 |
1 |
2 |
3 |
2 |
2 |
|
Corporate debt instruments |
2 |
1 |
1 |
2 |
2 |
2 |
|
Mortgage loans |
(1) |
(1) |
(1) |
(1) |
(1) |
(1) |
|
Other loans |
(1) |
(1) |
(1) |
(1) |
(1) |
(1) |
|
Other or unspecified interest |
2 |
4 |
4 |
2 |
2 |
2 |
|
Total interest earnings |
7 |
8 |
10 |
8 |
7 |
7 |
|
Total dividend income |
2 |
2 |
2 |
3 |
2 |
2 |
|
Net gain (loss) on sale of assets |
12 |
3 |
8 |
13 |
12 |
12 |
|
Unrealized appreciation (depreciation) of assets |
15 |
7 |
14 |
20 |
18 |
13 |
|
Net investment gain (loss) from common/collective trusts |
4 |
2 |
6 |
5 |
3 |
4 |
|
Net investment gain (loss) from pooled separate accounts |
2 |
2 |
6 |
3 |
2 |
2 |
|
Net investment gain (loss) from master trusts |
43 |
9 |
15 |
27 |
40 |
51 |
|
Net investment gain (loss) from registered investment companies |
2 |
5 |
7 |
4 |
2 |
1 |
|
Other or unspecified income |
1 |
5 |
4 |
2 |
3 |
1 |
Footnotes
- Less than one percent.
Note: Percentage distributions may not add to 100 because of rounding.
Source: Form 5500 series reports filed with the Internal Revenue Service for plan years beginning in 1997.
|
Income and Expenses |
Total |
$1-.9M |
$1.0M-9.9M |
$10.0M-249.9M |
$250.0M-999.9M |
$1.0B or More |
|---|---|---|---|---|---|---|
|
Total Income |
100 |
100 |
100 |
100 |
100 |
100 |
|
Contributions received or receivable from: |
||||||
|
Employers |
12 |
24 |
19 |
16 |
12 |
7 |
|
Participants |
19 |
47 |
30 |
22 |
18 |
14 |
|
Others |
1 |
5 |
4 |
2 |
1 |
(1) |
|
Total contributions |
33 |
76 |
53 |
40 |
32 |
22 |
|
Interest earnings: |
||||||
|
Interest-bearing cash |
1 |
1 |
1 |
1 |
1 |
1 |
|
Certificates of deposit |
(1) |
(1) |
(1) |
(1) |
(1) |
(1) |
|
U.S. Government securities |
(1) |
(1) |
(1) |
1 |
(1) |
(1) |
|
U.S. Government securities |
(1) |
(1) |
(1) |
(1) |
(1) |
(1) |
|
Mortgage loans |
(1) |
(1) |
(1) |
(1) |
(1) |
(1) |
|
Other loans |
(1) |
(1) |
(1) |
(1) |
(1) |
(1) |
|
Other or unspecified interest |
2 |
1 |
2 |
2 |
2 |
2 |
|
Total interest earnings |
4 |
2 |
4 |
5 |
4 |
4 |
|
Total dividend income |
3 |
1 |
2 |
3 |
4 |
3 |
|
Net gain (loss) on sale of assets |
5 |
2 |
2 |
4 |
5 |
6 |
|
Unrealized appreciation (depreciation) of assets |
23 |
1 |
7 |
15 |
25 |
31 |
|
Net investment gain (loss) from common/collective trusts |
4 |
1 |
3 |
4 |
3 |
4 |
|
Net investment gain (loss) from pooled separate accounts |
2 |
6 |
8 |
3 |
1 |
1 |
|
Net investment gain (loss) from master trusts |
13 |
(1) |
1 |
6 |
12 |
22 |
|
Net investment gain (loss) from registered investment companies |
12 |
6 |
15 |
18 |
12 |
6 |
|
Other or unspecified income |
2 |
4 |
5 |
2 |
1 |
(1) |
Footnotes
- Less than one percent.
Note: Percentage distributions may not add to 100 because of rounding.
Source: Form 5500 series reports filed with the Internal Revenue Service for plan years beginning in 1997.
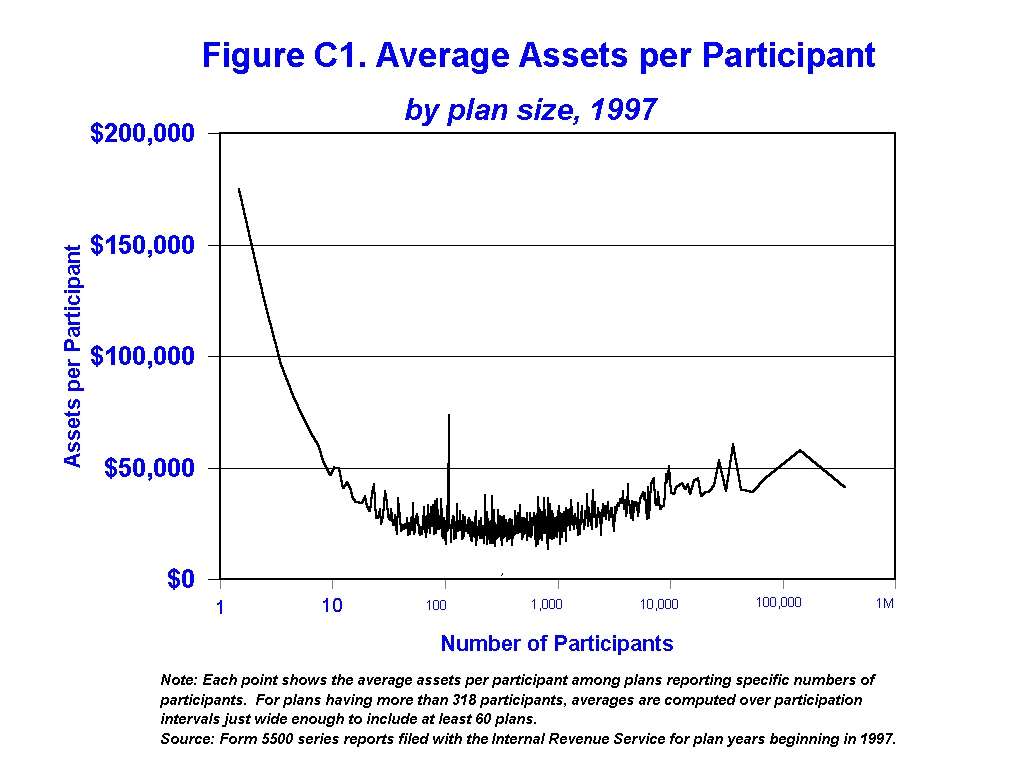
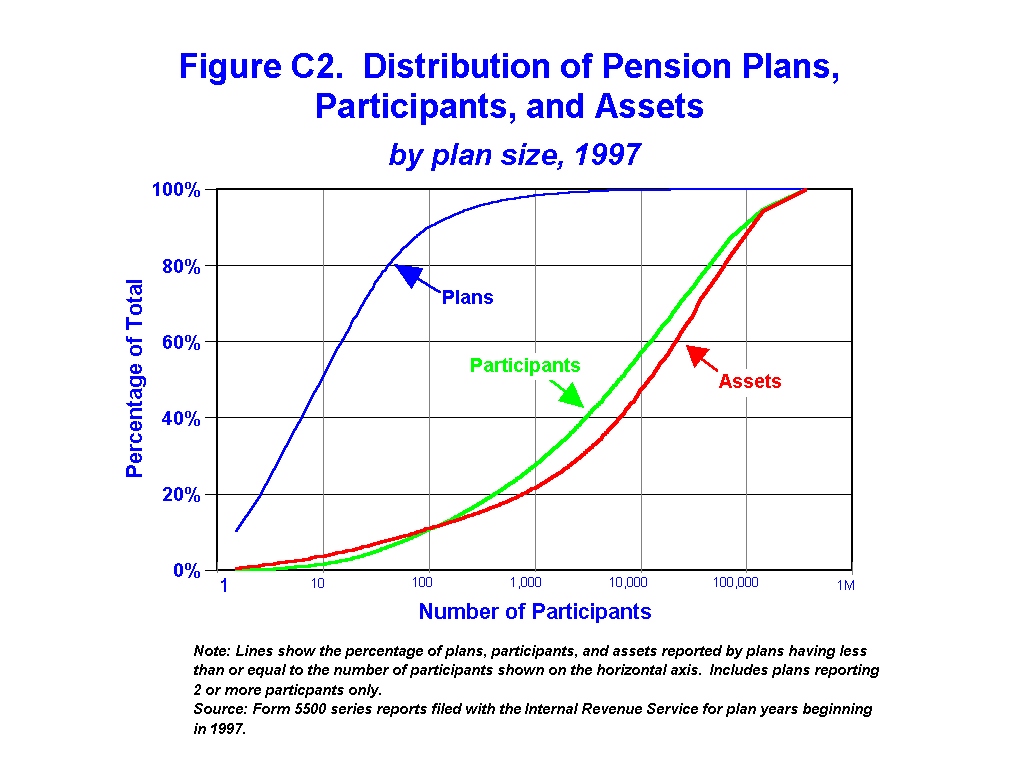
Section D: Defined Contribution Plans
|
Type of Asset or Liability |
Total Defined Contribution Plans |
Profit Sharing and Thrift-Savings Plans |
Stock Bonus Plans |
Target Benefit Plans |
Money Purchase Plans |
Other Defined Contribution Plans |
|---|---|---|---|---|---|---|
|
Assets |
||||||
|
Receivables |
||||||
|
Employer contributions |
$13,565 |
$11,196 |
$1,005 |
$34 |
$1,197 |
$133 |
|
Participant contributions |
1,686 |
1,579 |
39 |
1 |
27 |
41 |
|
Income receivables |
1,698 |
1,260 |
114 |
23 |
235 |
66 |
|
Other receivables |
5,140 |
4,564 |
267 |
9 |
205 |
94 |
|
Less allowance for doubtful accounts |
10 |
3 |
(1) |
(1) |
6 |
1 |
|
Total receivables (net) |
22,080 |
18,596 |
1,425 |
68 |
1,658 |
333 |
|
General Investments |
||||||
|
Interest-bearing cash |
32,466 |
26,659 |
2,000 |
106 |
2,943 |
759 |
|
Certificates of deposit |
2,438 |
1,573 |
30 |
1 |
704 |
130 |
|
U.S. Government securities |
27,048 |
16,057 |
596 |
122 |
8,638 |
1,635 |
|
Corporate debt instruments: Preferred |
10,937 |
8,807 |
460 |
17 |
1,169 |
484 |
|
Corporate debt instruments: All other |
13,560 |
8,620 |
356 |
42 |
3,642 |
899 |
|
Preferred stock |
14,604 |
13,830 |
524 |
3 |
168 |
79 |
|
Common stock |
112,265 |
85,208 |
9,387 |
297 |
12,922 |
4,452 |
|
Partnership/joint venture interests |
868 |
709 |
2 |
10 |
122 |
25 |
|
Income-producing real estate |
609 |
381 |
3 |
(1) |
164 |
62 |
|
Nonincome-producing real estate |
85 |
63 |
(1) |
(1) |
6 |
16 |
|
Residential loans (other than to participants) secured by mortgages |
538 |
403 |
2 |
(1) |
124 |
8 |
|
Commercial loans secured by mortgages |
276 |
192 |
1 |
(1) |
80 |
3 |
|
Mortgage loans to participants |
787 |
686 |
52 |
(1) |
17 |
31 |
|
Other loans to participants |
22,681 |
20,630 |
1,297 |
6 |
448 |
299 |
|
Other loans |
1,252 |
1,207 |
1 |
17 |
22 |
4 |
|
Value of interest in common/collective trusts |
104,360 |
93,557 |
2,822 |
107 |
4,646 |
3,227 |
|
Value of interest in pooled separate accounts |
51,631 |
48,027 |
62 |
36 |
3,165 |
340 |
|
Value of interest in master trusts |
309,082 |
273,919 |
22,965 |
885 |
9,532 |
1,781 |
|
Value of interest in 103-12 investment entities |
2,932 |
2,514 |
127 |
(1) |
292 |
(1) |
|
Value of interest in registered investment companies |
342,410 |
310,786 |
9,084 |
488 |
16,576 |
5,477 |
|
Value of funds held in insurance company general account |
78,431 |
68,953 |
1,733 |
73 |
6,472 |
1,200 |
|
Other or unspecified general investments |
47,621 |
40,166 |
2,691 |
46 |
3,853 |
865 |
|
Total general investments |
1,176,880 |
1,022,945 |
54,196 |
2,256 |
75,706 |
21,777 |
|
Employer securities |
243,017 |
169,656 |
63,187 |
12 |
1,490 |
8,670 |
|
Employer real property |
477 |
477 |
1 |
(1) |
(1) |
(1) |
|
Unspecified investments |
401 |
276 |
(1) |
(1) |
88 |
36 |
|
Total noninterest-bearing cash |
2,113 |
1,831 |
68 |
1 |
180 |
32 |
|
Buildings and other property used in plan operations |
23 |
2 |
(1) |
(1) |
16 |
5 |
|
Total Assets |
1,444,991 |
1,213,784 |
118,877 |
2,337 |
79,140 |
30,853 |
|
Liabilities |
||||||
|
Benefit claims payable |
4,323 |
3,121 |
701 |
5 |
342 |
155 |
|
Operating payables |
1,969 |
1,370 |
511 |
1 |
56 |
30 |
|
Acquisition indebtedness |
13,120 |
7,034 |
5,424 |
(1) |
35 |
627 |
|
Other liabilities |
15,538 |
9,935 |
4,718 |
1 |
279 |
605 |
|
Total Liabilities |
34,951 |
21,460 |
11,355 |
6 |
711 |
1,418 |
|
Net Assets |
1,410,041 |
1,192,324 |
107,523 |
2,331 |
78,428 |
29,435 |
Footnotes
- Less than $500,000.
Source: Form 5500 series reports filed with the Internal Revenue Service for plan years beginning in 1997.
|
Income and Expenses |
Total Defined Contribution Plans |
Profit Sharing and Thrift-Savings Plans |
Stock Bonus Plans |
Target Benefit Plans |
Money Purchase Plans |
Other Defined Contribution Plans |
|---|---|---|---|---|---|---|
|
Income |
||||||
|
Contributions received or receivable from: |
||||||
|
Employers |
$42,859 |
$32,414 |
$3,847 |
$111 |
$5,524 |
$963 |
|
Participants |
66,826 |
62,443 |
2,949 |
14 |
627 |
794 |
|
Others |
5,202 |
4,754 |
168 |
3 |
186 |
89 |
|
Noncash contributions |
883 |
374 |
501 |
0 |
1 |
8 |
|
Total contributions |
115,770 |
99,984 |
7,465 |
128 |
6,337 |
1,854 |
|
Interest earnings: |
||||||
|
Interest-bearing cash |
3,819 |
3,302 |
174 |
3 |
243 |
95 |
|
Certificates of deposit |
149 |
94 |
4 |
(1) |
43 |
7 |
|
U.S. Government securities |
1,592 |
893 |
34 |
7 |
557 |
103 |
|
Corporate debt instruments |
1,074 |
763 |
20 |
3 |
232 |
56 |
|
Mortgage loans |
85 |
64 |
(1) |
(1) |
17 |
3 |
|
Other loans |
1,226 |
1,115 |
59 |
(1) |
38 |
15 |
|
Other or unspecified interest |
7,491 |
6,577 |
205 |
6 |
550 |
152 |
|
Total interest earnings |
15,436 |
12,807 |
497 |
20 |
1,681 |
432 |
|
Dividends: |
||||||
|
Preferred stock |
1,588 |
1,015 |
471 |
(1) |
31 |
71 |
|
Common stock |
9,317 |
7,593 |
1,061 |
10 |
429 |
224 |
|
Total dividend income |
10,906 |
8,608 |
1,531 |
10 |
461 |
296 |
|
Rents |
72 |
56 |
(1) |
(1) |
9 |
6 |
|
Net gain (loss) on sale of assets |
16,916 |
13,233 |
1,719 |
24 |
1,274 |
666 |
|
Unrealized appreciation (depreciation) of assets |
79,972 |
60,522 |
13,664 |
69 |
2,911 |
2,806 |
|
Net investment gain (loss) from common/collective trusts |
13,006 |
11,757 |
544 |
8 |
508 |
188 |
|
Net investment gain (loss) from pooled separate accounts |
7,896 |
7,375 |
28 |
15 |
442 |
36 |
|
Net investment gain (loss) from master trusts |
45,702 |
39,219 |
4,890 |
77 |
1,210 |
306 |
|
Net investment gain (loss) from 103-12 investment entities |
430 |
399 |
1 |
0 |
29 |
(1) |
|
Net investment gain (loss) from registered investment companies |
41,895 |
38,461 |
1,000 |
78 |
1,858 |
498 |
|
Other or unspecified income |
5,183 |
4,363 |
412 |
4 |
334 |
70 |
|
Total Income |
353,183 |
296,784 |
31,753 |
433 |
17,053 |
7,159 |
|
Expenses |
||||||
|
Benefit payments and payments to provide benefits: |
||||||
|
Direct benefits |
98,483 |
83,665 |
7,763 |
111 |
4,839 |
2,106 |
|
Payments to insurance carriers |
342 |
152 |
1 |
4 |
149 |
35 |
|
Other benefits |
1,096 |
672 |
281 |
(1) |
106 |
37 |
|
Total payments |
99,920 |
84,489 |
8,045 |
115 |
5,094 |
2,178 |
|
Interest expense |
2,099 |
1,171 |
857 |
(1) |
3 |
67 |
|
Administrative expenses: |
||||||
|
Salaries and allowances |
63 |
39 |
(1) |
(1) |
18 |
5 |
|
Accounting fees |
47 |
33 |
1 |
(1) |
10 |
3 |
|
Actuarial fees |
17 |
10 |
1 |
1 |
3 |
2 |
|
Contract administrator fees |
177 |
127 |
7 |
(1) |
33 |
9 |
|
Investment advisory and management fees |
569 |
415 |
13 |
3 |
107 |
30 |
|
Legal fees |
29 |
14 |
1 |
(1) |
11 |
4 |
|
Valuation/appraisal fees |
8 |
7 |
1 |
1/ |
1 |
1/ |
|
Trustee fees/expenses |
240 |
205 |
15 |
1 |
13 |
7 |
|
Other administrative expenses |
596 |
478 |
29 |
1 |
62 |
26 |
|
Total administrative expenses |
1,745 |
1,327 |
68 |
6 |
258 |
86 |
|
Other or unspecified expenses |
9 |
3 |
6 |
(1) |
(1) |
(1) |
|
Total Expenses |
103,773 |
86,989 |
8,976 |
121 |
5,355 |
2,331 |
|
Net Income |
249,410 |
209,795 |
22,777 |
312 |
11,698 |
4,828 |
Footnotes
- Less than $500,000.
Source: Form 5500 series reports filed with the Internal Revenue Service for plan years beginning in 1997.
|
Type of Plan |
Number of Plans(1) |
Total Participants (thousands)(2) |
Active Participants (thousands)(3) |
Total Assets (millions) |
Total Contributions (millions)(4) |
Total Benefits (millions)(5) |
|---|---|---|---|---|---|---|
|
Total |
265,251 |
38,484 |
33,865 |
$1,264,168 |
$115,673 |
$93,070 |
|
Profit sharing and thrift-savings |
258,341 |
36,759 |
32,342 |
1,183,851 |
110,083 |
87,181 |
|
Stock bonus |
614 |
1,165 |
997 |
71,678 |
4,664 |
5,240 |
|
Target benefit |
121 |
6 |
6 |
240 |
23 |
13 |
|
Money purchase |
4,374 |
448 |
420 |
7,027 |
728 |
533 |
|
Annuity-403(b)(1) |
130 |
3 |
3 |
21 |
7 |
2 |
|
Custodial account-403(b)(7) |
27 |
2 |
1 |
66 |
6 |
10 |
|
IRAs or annuities (Code 408) |
118 |
7 |
6 |
143 |
19 |
10 |
|
Other defined contribution |
1,527 |
95 |
90 |
1,143 |
144 |
81 |
Footnotes
- Excludes plans covering only one participant.
- Includes active, retired, and separated vested participants not yet in pay status. The number of participants also includes double counting of workers in more than one plan.
- Active participants include any workers currently in employment covered by a plan and who are earning or retaining credited service under a plan. Active participants also include nonvested former employees who have not yet incurred a break in service.
- Includes both employer and employee contributions.
- Amounts shown include both benefits paid directly from trust funds and premium payments made by plans to insurance carriers. Amounts exclude benefits made directly by insurance carriers.
Source: Form 5500 series reports filed with the Internal Revenue Service for plan years beginning in 1997.
Source: Form 5500 series reports filed with the Internal Revenue Service for plan years beginning in 1997.
Source: Form 5500 series reports filed with the Internal Revenue Service for plan years beginning in 1997.
|
Number of Participants |
Total |
Total |
Total |
Investments are participant directed(1) |
Investments are participant directed(1) |
Investments are participant directed(1) |
Investments are not participant directed |
Investments are not participant directed |
Investments are not participant directed |
|---|---|---|---|---|---|---|---|---|---|
|
Total |
265,251 |
33,865 |
$1,264,168 |
206,901 |
28,205 |
$1,043,525 |
58,351 |
5,660 |
$220,644 |
|
None or not reported |
8,780 |
- |
2,180 |
6,005 |
- |
1,191 |
2,775 |
- |
989 |
|
1-9 |
53,983 |
308 |
10,630 |
38,576 |
225 |
6,306 |
15,407 |
83 |
4,325 |
|
10-24 |
78,457 |
1,215 |
30,453 |
61,818 |
962 |
22,374 |
16,639 |
253 |
8,079 |
|
25-49 |
53,285 |
1,769 |
40,958 |
41,678 |
1,381 |
30,363 |
11,607 |
389 |
10,595 |
|
50-99 |
33,218 |
2,200 |
53,526 |
27,142 |
1,796 |
41,663 |
6,076 |
404 |
11,863 |
|
100-249 |
20,523 |
2,893 |
69,685 |
17,313 |
2,454 |
56,955 |
3,211 |
439 |
12,730 |
|
250-499 |
8,090 |
2,473 |
58,825 |
6,900 |
2,112 |
48,943 |
1,190 |
361 |
9,882 |
|
500-999 |
4,222 |
2,606 |
66,114 |
3,584 |
2,214 |
55,107 |
638 |
391 |
11,007 |
|
1,000-2,499 |
2,725 |
3,714 |
106,175 |
2,296 |
3,131 |
89,629 |
429 |
583 |
16,546 |
|
2,500-4,999 |
1,028 |
3,160 |
114,672 |
834 |
2,557 |
92,038 |
194 |
603 |
22,634 |
|
5,000-9,999 |
498 |
3,034 |
141,534 |
389 |
2,372 |
110,742 |
109 |
662 |
30,791 |
|
10,000-19,999 |
254 |
3,075 |
160,211 |
202 |
2,465 |
129,060 |
52 |
610 |
31,150 |
|
20,000-49,999 |
141 |
3,682 |
206,096 |
121 |
3,177 |
184,847 |
20 |
505 |
21,249 |
|
50,000 or more |
47 |
3,737 |
203,109 |
43 |
3,360 |
174,305 |
4 |
377 |
28,804 |
Footnotes
- Includes both plans where investment of all assets are directed by participants and plans where only assets based on employee contributions are directed by participants.
Source: Form 5500 series reports filed with the Internal Revenue Service for plan years beginning in 1997.
Source: Form 5500 series reports filed with the Internal Revenue Service for plan years beginning in 1997.
|
Income and Expenses |
Total |
401(k) Plan is Only Plan Sponsored by Employer |
Employer Sponsoring01(k) Plan Also Sponsors Another Pension Plan(s) |
|---|---|---|---|
|
Income |
|||
|
Contributions received or receivable from: |
|||
|
Employers |
$36,071 |
$17,415 |
$18,655 |
|
Participants |
72,456 |
28,504 |
43,952 |
|
Others |
6,433 |
3,969 |
2,463 |
|
Noncash contributions |
714 |
47 |
667 |
|
Total contributions |
115,673 |
49,935 |
65,738 |
|
Investment earnings (1) |
20,329 |
4,439 |
15,890 |
|
Net gain (loss) on sale of assets |
14,449 |
4,151 |
10,298 |
|
Other or unspecified income (2) |
173,885 |
48,836 |
125,048 |
|
Total Income |
324,336 |
107,362 |
216,974 |
|
Expenses |
|||
|
Benefit payments and payments to provide benefits |
|||
|
Direct benefits |
91,744 |
31,252 |
60,491 |
|
Other benefits |
1,326 |
823 |
503 |
|
Total payments |
93,070 |
32,075 |
60,995 |
|
Total administrative expenses |
1,475 |
764 |
711 |
|
Other or unspecified expenses |
1,571 |
461 |
1,109 |
|
Total Expenses |
96,116 |
33,301 |
62,815 |
|
Net Income |
228,220 |
74,061 |
154,159 |
Footnotes
- Includes interest earnings, dividends, and rents.
- Includes net gain (loss) from pooled funds, unrealized appreciation (depreciation) of assets, and miscellaneous other income items.
Source: Form 5500 series reports filed with the Internal Revenue Service for plan years beginning in 1997.
|
Type of Asset or Liability |
Total |
401(k) Plan is Only Plan Sponsored by Employer |
Employer Sponsoring 401(k) Plan Also Sponsors Another Pension Plan(s) |
|---|---|---|---|
|
Assets |
|||
|
Receivables |
|||
|
Employer contributions |
$8,194 |
$3,979 |
$4,215 |
|
Participant contributions |
1,532 |
622 |
910 |
|
Income receivables |
1,106 |
237 |
870 |
|
Other receivables |
3,929 |
953 |
2,976 |
|
Less allowance for doubtful accounts |
1 |
1 |
(1) |
|
Total receivables (net) |
14,760 |
5,790 |
8,971 |
|
General Investments |
|||
|
Interest-bearing cash |
23,893 |
8,171 |
15,722 |
|
Certificates of deposit |
1,170 |
355 |
815 |
|
U.S. Government securities |
11,112 |
3,130 |
7,982 |
|
Corporate debt instruments: Preferred |
6,681 |
3,314 |
3,367 |
|
Corporate debt instruments: All other |
6,033 |
2,102 |
3,931 |
|
Preferred stock |
3,480 |
596 |
2,884 |
|
Common stock |
66,840 |
16,233 |
50,607 |
|
Partnership/joint venture interests |
308 |
236 |
72 |
|
Income-producing real estate |
293 |
198 |
95 |
|
Nonincome-producing real estate |
33 |
22 |
11 |
|
Residential loans (other than to participants) secured by mortgages |
332 |
61 |
271 |
|
Commercial loans secured by mortgages |
91 |
80 |
11 |
|
Mortgage loans to participants |
713 |
170 |
543 |
|
Other loans to participants |
20,398 |
5,180 |
15,218 |
|
Other loans |
1,175 |
177 |
997 |
|
Value of interest in common/collective trusts |
86,985 |
20,621 |
66,363 |
|
Value of interest in pooled separate accounts |
45,439 |
24,991 |
20,449 |
|
Value of interest in master trusts |
266,831 |
27,277 |
239,554 |
|
Value of interest in 103-12 investment entities |
1,991 |
284 |
1,707 |
|
Value of interest in registered investment companies |
288,731 |
105,778 |
182,953 |
|
Value of funds held in insurance company general account |
65,588 |
14,552 |
51,036 |
|
Other or unspecified general investments |
36,551 |
12,114 |
24,437 |
|
Total general investments |
934,667 |
245,642 |
689,025 |
|
Employer securities |
174,748 |
16,778 |
157,970 |
|
Employer real property |
399 |
324 |
75 |
|
Unspecified investments |
257 |
257 |
(1) |
|
Total noninterest-bearing cash |
1,589 |
550 |
1,039 |
|
Buildings and other property used in plan operations |
(1) |
(1) |
(1) |
|
Total Assets |
1,126,421 |
269,341 |
857,080 |
|
Liabilities |
|||
|
Benefit claims payable |
2,670 |
684 |
1,986 |
|
Operating payables |
1,579 |
104 |
1,475 |
|
Acquisition indebtedness |
6,346 |
959 |
5,387 |
|
Other liabilities |
10,395 |
1,579 |
8,816 |
|
Total Liabilities |
20,991 |
3,326 |
17,665 |
|
Net Assets |
1,105,430 |
266,014 |
839,415 |
Footnotes
- Less than $500,000.
Source: Form 5500 series reports filed with the Internal Revenue Service for plan years beginning in 1997.
|
Income and Expenses |
Total |
401(k) Plan is Only Plan Sponsored by Employer |
Employer Sponsoring 401(k) Plan Also Sponsors Another Pension Plan(s) |
|---|---|---|---|
|
Income |
|||
|
Contributions received or receivable from: |
|||
|
Employers |
$28,064 |
$10,312 |
$17,752 |
|
Participants |
62,967 |
20,265 |
42,702 |
|
Others |
4,430 |
2,462 |
1,967 |
|
Noncash contributions |
694 |
29 |
665 |
|
Total contributions |
96,154 |
33,068 |
63,086 |
|
Interest earnings: |
|||
|
Interest-bearing cash |
3,066 |
854 |
2,213 |
|
Certificates of deposit |
76 |
20 |
56 |
|
U.S. Government securities |
627 |
215 |
412 |
|
Corporate debt instruments |
593 |
200 |
392 |
|
Mortgage loans |
52 |
14 |
39 |
|
Other loans |
1,082 |
287 |
795 |
|
Other or unspecified interest |
6,078 |
1,313 |
4,765 |
|
Total interest earnings |
11,574 |
2,903 |
8,671 |
|
Dividends: |
|||
|
Preferred stock |
874 |
96 |
779 |
|
Common stock |
7,501 |
1,289 |
6,212 |
|
Total dividend income |
8,376 |
1,385 |
6,991 |
|
Rents |
45 |
43 |
2 |
|
Net gain (loss) on sale of assets |
12,060 |
2,331 |
9,729 |
|
Unrealized appreciation (depreciation) of assets |
54,937 |
8,485 |
46,453 |
|
Net investment gain (loss) from common/collective trusts |
11,294 |
2,296 |
8,998 |
|
Net investment gain (loss) from pooled separate accounts |
6,720 |
3,673 |
3,047 |
|
Net investment gain (loss) from master trusts |
40,438 |
3,918 |
36,520 |
|
Net investment gain (loss) from 103-12 investment entities |
246 |
62 |
184 |
|
Net investment gain (loss) from registered investment companies |
36,602 |
13,423 |
23,179 |
|
Other or unspecified income |
3,830 |
1,915 |
1,915 |
|
Total Income |
282,277 |
73,502 |
208,774 |
|
Expenses |
|||
|
Benefit payments and payments to provide benefits: |
|||
|
Direct benefits |
77,722 |
20,412 |
57,311 |
|
Payments to insurance carriers |
81 |
51 |
30 |
|
Other benefits |
602 |
156 |
446 |
|
Total payments |
78,405 |
20,618 |
57,787 |
|
Interest expense |
1,208 |
115 |
1,092 |
|
Administrative expenses: |
|||
|
Salaries and allowances |
32 |
11 |
20 |
|
Accounting fees |
26 |
14 |
13 |
|
Actuarial fees |
7 |
2 |
5 |
|
Contract administrator fees |
125 |
54 |
71 |
|
Investment advisory and management fees |
321 |
139 |
182 |
|
Legal fees |
11 |
3 |
8 |
|
Valuation/appraisal fees |
6 |
2 |
4 |
|
Trustee fees/expenses |
184 |
65 |
119 |
|
Other administrative expenses |
442 |
194 |
247 |
|
Total administrative expenses |
1,154 |
485 |
669 |
|
Other or unspecified expenses |
2 |
2 |
(1) |
|
Total Expenses |
80,768 |
21,220 |
59,548 |
|
Net Income |
201,509 |
52,282 |
149,227 |
Source: Form 5500 series reports filed with the Internal Revenue Service for plan years beginning in 1997.
|
Type of Plan |
Number of Plans(1) |
Total Participants (thousands)(2) |
Active Participants (thousands)(3) |
Total Assets (millions) |
Total Contributions (millions)(4) |
Total Benefits (millions)(5) |
|---|---|---|---|---|---|---|
|
Total ESOPs |
8,466 |
7,364 |
6,268 |
$369,656 |
$19,375 |
$26,697 |
|
Profit sharing and thrift-savings |
3,007 |
4,043 |
3,434 |
260,195 |
12,776 |
18,518 |
|
Stock bonus |
4,042 |
2,915 |
2,495 |
98,448 |
6,000 |
7,314 |
|
Target benefit |
3 |
3 |
3 |
61 |
6 |
6 |
|
Money purchase |
85 |
33 |
26 |
1,220 |
63 |
61 |
|
Annuity-403(b)(1) |
46 |
0 |
0 |
0 |
0 |
0 |
|
403(b)(7) |
2 |
2 |
1 |
66 |
5 |
10 |
|
IRAs or annuities (Code 408) |
37 |
0 |
0 |
16 |
1 |
0 |
|
Other defined contribution |
1,246 |
368 |
308 |
9,650 |
523 |
788 |
Footnotes
- Excludes plans covering only one participant.
- Includes active, retired, and separated vested participants not yet in pay status. The number of participants also includes double counting of workers in more than one plan.
- Active participants include any workers currently in employment covered by a plan and who are earning or retaining credited service under a plan. Active participants also include nonvested former employees who have not yet incurred a break in service.
- Includes both employer and employee contributions.
- Amounts shown include both benefits paid directly from trust funds and premium payments made by plans to insurance carriers. Amounts excludebenefits made directly by insurance carriers.
Source: Form 5500 series reports filed with the Internal Revenue Service for plan years beginning in 1997.
|
Type of Plan |
Number of Plans (1) |
Total Participants (thousands)(2) |
Active Participants (thousands)(3) |
Total Assets (millions) |
Total Contributions (millions)(4) |
Total Benefits (millions)(5) |
|---|---|---|---|---|---|---|
|
Total ESOPs |
8,466 |
7,364 |
6,268 |
$369,656 |
$19,375 |
$26,697 |
|
Nonleveraged ESOPs |
4,775 |
3,546 |
3,049 |
94,385 |
5,738 |
8,069 |
|
Leveraged ESOPs |
3,691 |
3,818 |
3,218 |
275,271 |
13,637 |
18,628 |
Footnotes
- Excludes plans covering only one participant.
- Includes active, retired, and separated vested participants not yet in pay status. The number of participants also includes double counting of workers in more than one plan.
- Active participants include any workers currently in employment covered by a plan and who are earning or retaining credited service under a plan. Active participants also include nonvested former employees who have not yet incurred a break in service.
- Includes both employer and employee contributions.
- Amounts shown include both benefits paid directly from trust funds and premium payments made by plans to insurance carriers. Amounts excludebenefits made directly by insurance carriers.
Source: Form 5500 series reports filed with the Internal Revenue Service for plan years beginning in 1997.
Source: Form 5500 series reports filed with the Internal Revenue Service for plan years beginning in 1997.
|
Type of Asset or Liability |
Total ESOPs |
Nonleveraged ESOPs |
Leveraged ESOPs |
|---|---|---|---|
|
Assets |
|||
|
Receivables |
|||
|
Employer contributions |
$1,983 |
$955 |
$1,028 |
|
Participant contributions |
191 |
100 |
91 |
|
Income receivables |
467 |
82 |
386 |
|
Other receivables |
801 |
435 |
366 |
|
Allowance for doubtful accounts |
(1) |
0 |
(1) |
|
Total receivables (net) |
3,443 |
1,572 |
1,870 |
|
General Investments |
|||
|
Interest-bearing cash |
3,892 |
1,946 |
1,946 |
|
Certificates of deposit |
204 |
46 |
158 |
|
U.S. Government securities |
2,646 |
431 |
2,216 |
|
Corporate debt instruments: Preferred |
3,038 |
214 |
2,824 |
|
Corporate debt instruments: All other |
1,486 |
339 |
1,148 |
|
Preferred stock |
12,301 |
1,461 |
10,840 |
|
Common stock |
34,958 |
6,922 |
28,035 |
|
Partnership/joint venture interests |
11 |
3 |
8 |
|
Income-producing real estate |
6 |
5 |
1 |
|
Nonincome-producing real estate |
(1) |
(1) |
(1) |
|
Residential loans (other than to participants) secured by mortgages |
5 |
2 |
3 |
|
Commercial loans secured by mortgages |
1 |
1 |
|
|
Mortgage loans to participants |
134 |
6 |
128 |
|
Other loans to participants |
4,353 |
1,091 |
3,261 |
|
Other loans |
3 |
1 |
2 |
|
Value of interest in common/collective trusts |
16,134 |
4,282 |
11,853 |
|
Value of interest in pooled separate accounts |
2,146 |
363 |
1,783 |
|
Value of interest in master trusts |
79,018 |
14,523 |
64,495 |
|
Value of interest in 103-12 investment entities |
756 |
132 |
624 |
|
Value of interest in registered investment companies |
33,916 |
10,335 |
23,581 |
|
Value of funds held in insurance company general account |
12,613 |
2,517 |
10,097 |
|
Other or unspecified general investments |
7,251 |
3,634 |
3,617 |
|
Total general investments |
214,869 |
48,252 |
166,617 |
|
Employer securities |
143,191 |
40,597 |
102,595 |
|
Employer real property |
5 |
5 |
|
|
Unspecified investments |
9 |
9 |
(1) |
|
Total noninterest-bearing cash |
141 |
90 |
50 |
|
Buildings and other property used in plan operations |
0 |
0 |
0 |
|
Total Assets |
361,659 |
90,526 |
271,132 |
|
Liabilities |
|||
|
Benefit claims payable |
1,282 |
765 |
518 |
|
Operating payables |
1,279 |
83 |
1,197 |
|
Acquisition indebtedness |
12,688 |
901 |
11,788 |
|
Other liabilities |
11,312 |
389 |
10,924 |
|
Total Liabilities |
26,562 |
2,137 |
24,426 |
|
Net Assets |
335,096 |
88,390 |
246,707 |
Footnotes
- Less than $500,000.
Source: Form 5500 series reports filed with the Internal Revenue Service for plan years beginning in 1997.
|
Income and Expenses |
Total ESOPs |
Nonleveraged ESOPs |
Leveraged ESOPs |
|---|---|---|---|
|
Income |
|||
|
Contributions received or receivable from: |
|||
|
Employers |
$7,705 |
$2,334 |
$5,372 |
|
Participants |
9,843 |
2,672 |
7,171 |
|
Others |
437 |
323 |
114 |
|
Noncash contributions |
662 |
152 |
510 |
|
Total contributions |
18,647 |
5,480 |
13,167 |
|
Interest earnings: |
|||
|
Interest-bearing cash |
498 |
216 |
282 |
|
Certificates of deposit |
13 |
2 |
12 |
|
U.S. Government securities |
163 |
15 |
148 |
|
Corporate debt instruments |
192 |
9 |
183 |
|
Mortgage loans |
3 |
(1) |
2 |
|
Other loans |
207 |
54 |
153 |
|
Other or unspecified interest |
1,030 |
300 |
730 |
|
Total interest earnings |
2,106 |
596 |
1,510 |
|
Dividends: |
|||
|
Preferred stock |
1,139 |
122 |
1,017 |
|
Common stock |
2,982 |
787 |
2,195 |
|
Total dividend income |
4,121 |
908 |
3,212 |
|
Rents |
6 |
4 |
2 |
|
Net gain (loss) on sale of assets |
3,795 |
1,061 |
2,734 |
|
Unrealized appreciation (depreciation) of assets |
38,834 |
10,913 |
27,921 |
|
Net investment gain (loss) from common/collective trusts |
3,630 |
842 |
2,788 |
|
Net investment gain (loss) from pooled separate accounts |
524 |
24 |
500 |
|
Net investment gain (loss) from master trusts |
13,559 |
2,374 |
11,185 |
|
Net investment gain (loss) from 103-12 investment entities |
160 |
7 |
153 |
|
Net investment gain (loss) from registered investment companies |
3,717 |
1,072 |
2,645 |
|
Other or unspecified income |
796 |
420 |
376 |
|
Total Income |
89,895 |
23,702 |
66,193 |
|
Expenses |
|||
|
Benefit payments and payments to provide benefits: |
|||
|
Direct benefits |
24,612 |
7,130 |
17,482 |
|
Payments to insurance carriers |
9 |
8 |
1 |
|
Other benefits |
341 |
149 |
191 |
|
Total payments |
24,962 |
7,287 |
17,675 |
|
Interest expense |
2,037 |
103 |
1,934 |
|
Administrative expenses: |
|||
|
Salaries and allowances |
4 |
(1) |
4 |
|
Accounting fees |
4 |
1 |
3 |
|
Actuarial fees |
1 |
1 |
(1) |
|
Contract administrator fees |
20 |
8 |
12 |
|
Investment advisory and management fees |
47 |
22 |
25 |
|
Legal fees |
2 |
1 |
1 |
|
Valuation/appraisal fees |
1 |
1 |
1 |
|
Trustee fees/expenses |
37 |
10 |
27 |
|
Other administrative expenses |
155 |
34 |
121 |
|
Total administrative expenses |
271 |
78 |
193 |
|
Other or unspecified expenses |
6 |
(1) |
6 |
|
Total Expenses |
27,276 |
7,468 |
19,808 |
|
Net Income |
62,619 |
16,234 |
46,385 |
Footnotes
- Less than $500,000.
Source: Form 5500 series reports filed with the Internal Revenue Service for plan years beginning in 1997.
Section E: Historical Tables
|
Year |
Total Plans |
Total Plans |
Total Plans |
Single Employer Plans (1) |
Single Employer Plans (1) |
Single Employer Plans (1) |
Multiemployer Plans (2) |
Multiemployer Plans (2) |
Multiemployer Plans (2) |
|---|---|---|---|---|---|---|---|---|---|
|
1978 |
442,998 |
128,407 |
314,591 |
440,443 |
126,238 |
314,205 |
2,555 |
2,169 |
386 |
|
1979 |
470,921 |
139,489 |
331,432 |
468,265 |
137,243 |
331,022 |
2,656 |
2,246 |
410 |
|
1980 |
488,901 |
148,096 |
340,805 |
486,142 |
145,764 |
340,378 |
2,759 |
2,332 |
427 |
|
1981 |
545,611 |
167,293 |
378,318 |
542,789 |
165,042 |
377,747 |
2,822 |
2,252 |
570 |
|
1982 |
594,456 |
174,998 |
419,458 |
591,417 |
172,662 |
418,755 |
3,039 |
2,336 |
703 |
|
1983 |
602,848 |
175,143 |
427,705 |
599,822 |
172,843 |
426,979 |
3,026 |
2,300 |
726 |
|
1984 |
604,434 |
168,015 |
436,419 |
601,413 |
165,732 |
435,681 |
3,021 |
2,283 |
738 |
|
1985 |
632,135 |
170,172 |
461,963 |
629,069 |
167,911 |
461,158 |
3,066 |
2,261 |
805 |
|
1986 |
717,627 |
172,642 |
544,985 |
714,563 |
170,431 |
544,132 |
3,063 |
2,210 |
853 |
|
1987 |
733,029 |
163,065 |
569,964 |
729,909 |
160,904 |
569,005 |
3,112 |
2,157 |
955 |
|
1988 |
729,922 |
145,952 |
583,971 |
726,648 |
143,833 |
582,815 |
3,275 |
2,119 |
1,156 |
|
1989 |
731,356 |
132,467 |
598,889 |
728,276 |
130,472 |
597,804 |
3,080 |
1,995 |
1,085 |
|
1990 |
712,308 |
113,062 |
599,245 |
709,404 |
111,251 |
598,153 |
2,904 |
1,812 |
1,092 |
|
1991 |
699,294 |
101,752 |
597,542 |
696,300 |
99,931 |
596,369 |
2,994 |
1,821 |
1,173 |
|
1992 |
708,335 |
88,621 |
619,714 |
705,226 |
86,797 |
618,429 |
3,109 |
1,824 |
1,285 |
|
1993 |
702,097 |
83,596 |
618,501 |
698,918 |
81,737 |
617,180 |
3,179 |
1,859 |
1,320 |
|
1994 |
690,344 |
74,422 |
615,922 |
687,158 |
72,555 |
614,603 |
3,186 |
1,867 |
1,319 |
|
1995 |
693,404 |
69,492 |
623,912 |
690,265 |
67,682 |
622,584 |
3,139 |
1,810 |
1,328 |
|
1996 |
696,224 |
63,657 |
632,566 |
692,957 |
61,790 |
631,167 |
3,267 |
1,867 |
1,399 |
|
1997 |
720,041 |
59,499 |
660,542 |
716,912 |
57,720 |
659,192 |
3,130 |
1,779 |
1,351 |
Footnotes
- Includes single employer plans, plans of controlled groups of corporations, and multiple-employer noncollectively bargained plans.
- Includes multiemployer plans and multiple-employer collectively bargained plans.
Source: Form 5500 series reports filed with the Internal Revenue Service for 1978-97 plan years.
|
Year |
Total Plans |
Total Plans |
Total Plans |
Single Employer Plans (1) |
Single Employer Plans (1) |
Single Employer Plans (1) |
Multiemployer Plans (2) |
Multiemployer Plans (2) |
Multiemployer Plans (2) |
|---|---|---|---|---|---|---|---|---|---|
|
1978 |
408,665 |
105,474 |
303,191 |
408,401 |
105,323 |
303,078 |
265 |
151 |
113 |
|
1979 |
435,334 |
116,143 |
319,191 |
435,053 |
115,954 |
319,099 |
281 |
189 |
92 |
|
1980 |
451,046 |
123,591 |
327,455 |
450,740 |
123,340 |
327,400 |
306 |
251 |
55 |
|
1981 |
505,368 |
142,304 |
363,064 |
505,109 |
142,165 |
362,944 |
259 |
139 |
120 |
|
1982 |
552,258 |
149,600 |
402,658 |
551,899 |
149,391 |
402,508 |
359 |
309 |
150 |
|
1983 |
558,146 |
149,164 |
408,982 |
557,847 |
148,955 |
408,892 |
299 |
209 |
90 |
|
1984 |
558,943 |
142,912 |
416,031 |
558,649 |
142,699 |
415,950 |
293 |
213 |
81 |
|
1985 |
583,476 |
145,430 |
438,046 |
583,171 |
145,292 |
437,879 |
305 |
138 |
167 |
|
1986 |
666,669 |
148,168 |
518,501 |
666,424 |
148,005 |
518,419 |
245 |
163 |
82 |
|
1987 |
681,238 |
139,644 |
541,594 |
680,921 |
139,472 |
541,449 |
310 |
169 |
141 |
|
1988 |
675,525 |
123,146 |
552,378 |
675,117 |
122,962 |
552,154 |
408 |
184 |
224 |
|
1989 |
675,706 |
111,048 |
564,658 |
675,470 |
110,941 |
564,529 |
236 |
107 |
129 |
|
1990 |
659,144 |
93,821 |
565,323 |
658,848 |
93,730 |
565,118 |
296 |
91 |
205 |
|
1991 |
645,517 |
83,298 |
562,218 |
645,182 |
83,181 |
562,001 |
334 |
117 |
217 |
|
1992 |
650,282 |
69,883 |
580,399 |
649,924 |
69,778 |
580,146 |
358 |
104 |
253 |
|
1993 |
642,615 |
64,937 |
577,678 |
642,196 |
64,799 |
577,396 |
419 |
137 |
282 |
|
1994 |
628,707 |
56,322 |
572,385 |
628,307 |
56,134 |
572,173 |
399 |
188 |
212 |
|
1995 |
631,117 |
52,405 |
578,712 |
630,780 |
52,311 |
578,469 |
337 |
94 |
243 |
|
1996 |
632,520 |
47,104 |
585,416 |
632,069 |
46,941 |
585,128 |
451 |
163 |
288 |
|
1997 |
653,696 |
43,647 |
610,049 |
653,347 |
43,519 |
609,828 |
350 |
128 |
222 |
Footnotes
- Includes single employer plans, plans of controlled groups of corporations, and multiple-employer noncollectively bargained plans.
- Includes multiemployer plans and multiple-employer collectively bargained plans.
Source: Form 5500 series reports filed with the Internal Revenue Service for 1978-97 plan years.
|
Year |
Total Plans |
Total Plans |
Total Plans |
Single Employer Plans (1) |
Single Employer Plans (1) |
Single Employer Plans (1) |
Multiemployer Plans (2) |
Multiemployer Plans (2) |
Multiemployer Plans (2) |
|---|---|---|---|---|---|---|---|---|---|
|
1978 |
34,333 |
22,933 |
11,400 |
32,042 |
20,915 |
11,127 |
2,290 |
2,018 |
273 |
|
1979 |
35,587 |
23,346 |
12,241 |
33,212 |
21,289 |
11,923 |
2,375 |
2,057 |
318 |
|
1980 |
37,855 |
24,505 |
13,350 |
35,402 |
22,424 |
12,978 |
2,453 |
2,081 |
372 |
|
1981 |
40,243 |
24,989 |
15,254 |
37,680 |
22,877 |
14,803 |
2,563 |
2,113 |
450 |
|
1982 |
42,198 |
25,398 |
16,800 |
39,518 |
23,271 |
16,247 |
2,680 |
2,127 |
553 |
|
1983 |
44,702 |
25,979 |
18,723 |
41,975 |
23,888 |
18,087 |
2,727 |
2,091 |
636 |
|
1984 |
45,491 |
25,103 |
20,388 |
42,763 |
23,033 |
19,731 |
2,728 |
2,070 |
657 |
|
1985 |
48,658 |
24,742 |
23,917 |
45,897 |
22,619 |
23,279 |
2,761 |
2,123 |
638 |
|
1986 |
50,958 |
24,474 |
26,484 |
48,139 |
22,426 |
25,713 |
2,818 |
2,047 |
771 |
|
1987 |
51,791 |
23,421 |
28,370 |
48,988 |
21,432 |
27,556 |
2,802 |
1,988 |
814 |
|
1988 |
54,397 |
22,805 |
31,593 |
51,530 |
20,870 |
30,661 |
2,867 |
1,935 |
932 |
|
1989 |
55,650 |
21,419 |
34,231 |
52,807 |
19,531 |
33,275 |
2,844 |
1,888 |
956 |
|
1990 |
53,164 |
19,242 |
33,922 |
50,556 |
17,521 |
33,035 |
2,608 |
1,721 |
887 |
|
1991 |
53,777 |
18,454 |
35,324 |
51,118 |
16,750 |
34,368 |
2,660 |
1,704 |
956 |
|
1992 |
58,053 |
18,738 |
39,315 |
55,302 |
17,019 |
38,283 |
2,751 |
1,719 |
1,032 |
|
1993 |
59,482 |
18,660 |
40,822 |
56,722 |
16,938 |
39,784 |
2,760 |
1,722 |
1,038 |
|
1994 |
61,638 |
18,100 |
43,538 |
58,851 |
16,421 |
42,430 |
2,787 |
1,679 |
1,108 |
|
1995 |
62,287 |
17,087 |
45,200 |
59,486 |
15,371 |
44,115 |
2,802 |
1,716 |
1,086 |
|
1996 |
63,704 |
16,553 |
47,150 |
60,888 |
14,849 |
46,039 |
2,815 |
1,704 |
1,111 |
|
1997 |
66,345 |
15,852 |
50,493 |
63,565 |
14,201 |
49,364 |
2,780 |
1,651 |
1,129 |
Footnotes
- Includes single employer plans, plans of controlled groups of corporations, and multiple-employer noncollectively bargained plans.
- Includes multiemployer plans and multiple-employer collectively bargained plans.
Source: Form 5500 series reports filed with the Internal Revenue Service for 1978-97 plan years.
|
Year |
Number of Wage and Salary Workers |
Workers Covered by a Primary Defined Benefit Plan |
Workers Covered by a Primary Defined Benefit Plan |
Workers Covered by a Primary Defined Contribution Plan |
Workers Covered by a Primary Defined Contribution Plan |
Workers Covered by a Supplemental Defined Contribution Plan(s) |
Workers Covered by a Supplemental Defined Contribution Plan(s) |
|---|---|---|---|---|---|---|---|
|
1978 |
75,939 |
28,613 |
38 |
5,424 |
7 |
8,258 |
11 |
|
1979 |
78,058 |
29,008 |
37 |
5,790 |
7 |
9,368 |
12 |
|
1980 |
78,349 |
29,736 |
38 |
6,203 |
8 |
10,134 |
13 |
|
1981 |
80,282 |
29,687 |
37 |
7,224 |
9 |
10,629 |
13 |
|
1982 |
82,318 |
29,361 |
36 |
8,120 |
10 |
12,087 |
15 |
|
1983 |
84,410 |
29,576 |
35 |
9,395 |
11 |
14,191 |
17 |
|
1984 |
86,732 |
29,812 |
34 |
9,902 |
11 |
15,303 |
18 |
|
1985 |
88,293 |
28,894 |
33 |
11,550 |
13 |
16,018 |
18 |
|
1986 |
90,267 |
28,536 |
32 |
12,672 |
14 |
16,188 |
18 |
|
1987 |
91,559 |
28,347 |
31 |
13,437 |
15 |
16,110 |
18 |
|
1988 |
93,012 |
27,864 |
30 |
14,106 |
15 |
15,180 |
16 |
|
1989 |
94,448 |
27,240 |
29 |
15,485 |
16 |
15,242 |
16 |
|
1990 |
94,772 |
26,323 |
28 |
16,116 |
17 |
15,671 |
17 |
|
1991 |
94,959 |
25,701 |
27 |
17,133 |
18 |
15,287 |
16 |
|
1992 |
96,577 |
25,318 |
26 |
19,474 |
20 |
16,300 |
17 |
|
1993 |
97,749 |
25,091 |
26 |
19,780 |
20 |
16,621 |
17 |
|
1994 |
101,077 |
24,591 |
24 |
20,948 |
21 |
16,516 |
16 |
|
1995 |
102,162 |
23,531 |
23 |
23,038 |
23 |
16,482 |
16 |
|
1996 |
104,313 |
23,262 |
22 |
24,173 |
23 |
17,199 |
16 |
|
1997 |
106,955 |
22,724 |
21 |
27,045 |
25 |
18,531 |
17 |
Footnotes
- For workers covered under both a defined benefit and a defined contribution plan, the defined benefit plan is designated as the primary plan unless the plan name indicates it provides supplemental or only past service benefits.
Sources: Number of workers taken from Employment and Earnings, Bureau of Labor Statistics, U.S. Department of Labor. These numbers include both employed (full and part-time) and unemployed wage and salary workers. The number of workers in primary and supplemental plans are estimates derived from annual Form 5500 reports filed with the Internal Revenue Service for 1978-97 plan years.
|
Year |
Total Plans |
Total Plans |
Total Plans |
Single Employer Plans (1) |
Single Employer Plans (1) |
Single Employer Plans (1) |
Multiemployer Plans (2) |
Multiemployer Plans (2) |
Multiemployer Plans (2) |
|---|---|---|---|---|---|---|---|---|---|
|
1978 |
52,371 |
36,103 |
16,268 |
43,665 |
27,762 |
15,903 |
8,707 |
8,341 |
365 |
|
1979 |
55,097 |
36,810 |
18,287 |
46,085 |
28,275 |
17,810 |
9,013 |
8,536 |
477 |
|
1980 |
57,903 |
37,979 |
19,924 |
48,910 |
29,555 |
19,354 |
8,993 |
8,423 |
570 |
|
1981 |
60,564 |
38,903 |
21,661 |
51,326 |
30,331 |
20,995 |
9,238 |
8,572 |
666 |
|
1982 |
63,243 |
38,633 |
24,610 |
54,105 |
30,289 |
23,816 |
9,138 |
8,343 |
794 |
|
1983 |
69,147 |
40,025 |
29,122 |
59,645 |
31,405 |
28,240 |
9,501 |
8,620 |
881 |
|
1984 |
73,895 |
40,980 |
32,915 |
64,244 |
32,329 |
31,915 |
9,651 |
8,651 |
1,000 |
|
1985 |
74,665 |
39,692 |
34,973 |
65,414 |
31,436 |
3,978 |
9,251 |
8,256 |
995 |
|
1986 |
76,672 |
39,989 |
36,682 |
67,069 |
31,676 |
35,392 |
9,603 |
8,313 |
1,290 |
|
1987 |
78,223 |
39,958 |
38,265 |
68,550 |
31,650 |
36,900 |
9,673 |
8,308 |
1,365 |
|
1988 |
77,685 |
40,722 |
36,963 |
67,734 |
32,386 |
35,348 |
9,951 |
8,336 |
1,615 |
|
1989 |
76,405 |
39,958 |
36,447 |
65,964 |
31,248 |
34,716 |
10,441 |
8,710 |
1,731 |
|
1990 |
76,924 |
38,832 |
38,091 |
67,003 |
30,522 |
36,481 |
9,921 |
8,311 |
1,611 |
|
1991 |
77,662 |
39,027 |
38,634 |
67,583 |
30,683 |
36,900 |
10,079 |
8,344 |
1,735 |
|
1992 |
81,914 |
39,531 |
42,383 |
71,783 |
31,395 |
40,388 |
10,131 |
8,136 |
1,995 |
|
1993 |
83,870 |
40,267 |
43,603 |
73,770 |
32,151 |
41,619 |
10,100 |
8,116 |
1,983 |
|
1994 |
85,117 |
40,338 |
44,778 |
74,940 |
32,197 |
42,743 |
10,177 |
8,142 |
2,035 |
|
1995 |
87,452 |
39,736 |
47,716 |
76,969 |
31,341 |
45,629 |
10,483 |
8,395 |
2,088 |
|
1996 |
91,716 |
41,111 |
50,605 |
80,841 |
32,467 |
48,374 |
10,876 |
8,644 |
2,231 |
|
1997 |
94,985 |
40,392 |
54,593 |
83,881 |
31,678 |
52,204 |
11,103 |
8,714 |
2,389 |
Footnotes
- Includes single employer plans, plans of controlled groups of corporations, and multiple-employer noncollectively bargained plans.
- Includes multiemployer plans and multiple-employer collectively bargained plans.
Source: Form 5500 series reports filed with the Internal Revenue Service for 1978-97 plan years.
|
Year |
Total Plans |
Total Plans |
Total Plans |
Single Employer Plans (1) |
Single Employer Plans (1) |
Single Employer Plans (1) |
Multiemployer Plans (2) |
Multiemployer Plans (2) |
Multiemployer Plans (2) |
|---|---|---|---|---|---|---|---|---|---|
|
1978 |
5,143 |
1,828 |
3,316 |
5,127 |
1,820 |
3,307 |
16 |
7 |
9 |
|
1979 |
5,389 |
1,802 |
3,587 |
5,372 |
1,792 |
3,580 |
17 |
10 |
7 |
|
1980 |
5,741 |
1,995 |
3,746 |
5,725 |
1,980 |
3,744 |
17 |
15 |
2 |
|
1981 |
6,298 |
2,154 |
4,143 |
6,283 |
2,148 |
4,135 |
15 |
6 |
9 |
|
1982 |
6,877 |
2,155 |
4,722 |
6,854 |
2,144 |
4,710 |
23 |
11 |
12 |
|
1983 |
6,872 |
2,154 |
4,718 |
6,855 |
2,144 |
4,711 |
17 |
10 |
7 |
|
1984 |
6,886 |
2,013 |
4,873 |
6,869 |
2,013 |
4,856 |
17 |
12 |
5 |
|
1985 |
7,553 |
2,059 |
5,495 |
7,537 |
2,052 |
5,486 |
16 |
8 |
9 |
|
1986 |
7,926 |
2,033 |
5,893 |
7,914 |
2,025 |
5,889 |
12 |
8 |
4 |
|
1987 |
8,413 |
2,008 |
6,405 |
8,400 |
2,000 |
6,400 |
13 |
8 |
5 |
|
1988 |
8,345 |
1,720 |
6,625 |
8,329 |
1,713 |
6,616 |
16 |
8 |
9 |
|
1989 |
8,200 |
1,396 |
6,804 |
8,188 |
1,392 |
6,796 |
12 |
4 |
8 |
|
1990 |
8,268 |
1,279 |
6,989 |
8,251 |
1,275 |
6,976 |
17 |
4 |
13 |
|
1991 |
8,441 |
1,226 |
7,215 |
8,424 |
1,218 |
7,206 |
17 |
8 |
8 |
|
1992 |
9,076 |
1,129 |
7,946 |
9,059 |
1,125 |
7,934 |
17 |
5 |
12 |
|
1993 |
9,087 |
1,030 |
8,057 |
9,067 |
1,024 |
8,043 |
20 |
6 |
14 |
|
1994 |
9,152 |
944 |
8,208 |
9,132 |
935 |
8,197 |
20 |
9 |
11 |
|
1995 |
9,373 |
893 |
8,480 |
9,359 |
890 |
8,469 |
14 |
3 |
11 |
|
1996 |
9,571 |
794 |
8,777 |
9,551 |
789 |
8,762 |
21 |
5 |
16 |
|
1978 |
10,276 |
731 |
9,546 |
10,257 |
724 |
9,533 |
19 |
6 |
13 |
Footnotes
- Includes single employer plans, plans of controlled groups of corporations, and multiple-employer noncollectively bargained plans.
- Includes multiemployer plans and multiple-employer collectively bargained plans.
Source: Form 5500 series reports filed with the Internal Revenue Service for 1978-97 plan years.
|
Year |
Total Plans |
Total Plans |
Total Plans |
Single Employer Plans (1) |
Single Employer Plans (1) |
Single Employer Plans (1) |
Multiemployer Plans (2) |
Multiemployer Plans (2) |
Multiemployer Plans (2) |
|---|---|---|---|---|---|---|---|---|---|
|
1978 |
47,228 |
34,275 |
12,953 |
38,537 |
25,941 |
12,596 |
8,691 |
8,334 |
357 |
|
1979 |
49,708 |
35,008 |
14,700 |
40,713 |
26,483 |
14,230 |
8,996 |
8,526 |
470 |
|
1980 |
52,162 |
35,984 |
16,178 |
43,185 |
27,575 |
15,610 |
8,977 |
8,408 |
568 |
|
1981 |
54,266 |
36,748 |
17,518 |
45,043 |
28,183 |
16,861 |
9,223 |
8,565 |
657 |
|
1982 |
56,366 |
36,446 |
19,920 |
47,248 |
28,112 |
19,136 |
9,118 |
8,332 |
785 |
|
1983 |
62,275 |
37,871 |
24,404 |
52,790 |
29,261 |
23,529 |
9,485 |
8,610 |
875 |
|
1984 |
67,009 |
38,967 |
28,042 |
57,375 |
30,316 |
27,059 |
9,634 |
8,640 |
995 |
|
1985 |
67,112 |
37,633 |
29,478 |
57,877 |
29,384 |
28,493 |
9,235 |
8,248 |
986 |
|
1986 |
68,746 |
37,956 |
30,790 |
59,155 |
29,651 |
29,503 |
9,591 |
8,305 |
1,286 |
|
1987 |
69,810 |
37,950 |
31,860 |
60,150 |
29,650 |
30,500 |
9,660 |
8,300 |
1,360 |
|
1988 |
69,340 |
39,002 |
30,338 |
59,404 |
30,673 |
28,732 |
9,935 |
8,326 |
1,606 |
|
1989 |
68,205 |
38,562 |
29,643 |
57,776 |
29,856 |
27,920 |
10,429 |
8,705 |
1,724 |
|
1990 |
68,655 |
37,553 |
31,102 |
58,752 |
29,247 |
29,505 |
9,904 |
8,306 |
1,598 |
|
1991 |
69,221 |
37,801 |
31,420 |
59,157 |
29,465 |
29,694 |
10,063 |
8,336 |
1,727 |
|
1992 |
72,838 |
38,402 |
34,436 |
62,724 |
30,270 |
32,454 |
10,114 |
8,132 |
1,982 |
|
1993 |
74,783 |
39,237 |
35,546 |
64,703 |
31,127 |
33,576 |
10,080 |
8,110 |
1,969 |
|
1994 |
75,964 |
39,394 |
36,570 |
65,807 |
31,262 |
34,546 |
10,157 |
8,133 |
2,024 |
|
1995 |
78,079 |
38,843 |
39,236 |
67,610 |
30,450 |
37,160 |
10,469 |
8,392 |
2,076 |
|
1996 |
82,145 |
40,317 |
41,828 |
71,290 |
31,677 |
39,613 |
10,855 |
8,640 |
2,215 |
|
1997 |
84,708 |
39,661 |
45,047 |
73,624 |
30,953 |
42,671 |
11,084 |
8,708 |
2,376 |
Footnotes
- Includes single employer plans, plans of controlled groups of corporations, and multiple-employer noncollectively bargained plans.
- Includes multiemployer plans and multiple-employer collectively bargained plans.
Source: Form 5500 series reports filed with the Internal Revenue Service for 1978-97 plan years.
|
Year |
Total Plans |
Total Plans |
Total Plans |
Single Employer Plans (1) |
Single Employer Plans (1) |
Single Employer Plans (1) |
Multiemployer Plans (2) |
Multiemployer Plans (2) |
Multiemployer Plans (2) |
|---|---|---|---|---|---|---|---|---|---|
|
1978 |
44,664 |
29,036 |
15,628 |
37,717 |
22,433 |
15,284 |
6,947 |
6,603 |
344 |
|
1979 |
46,929 |
29,440 |
17,489 |
39,799 |
22,757 |
17,041 |
7,130 |
6,683 |
447 |
|
1980 |
49,026 |
30,133 |
18,893 |
42,079 |
23,705 |
18,374 |
6,947 |
6,428 |
519 |
|
1981 |
50,826 |
30,082 |
20,743 |
43,821 |
23,701 |
20,120 |
7,005 |
6,381 |
623 |
|
1982 |
53,204 |
29,756 |
23,448 |
46,344 |
23,630 |
22,714 |
6,860 |
6,126 |
734 |
|
1983 |
57,808 |
29,964 |
27,844 |
50,911 |
23,877 |
27,034 |
6,897 |
6,087 |
810 |
|
1984 |
60,775 |
30,172 |
30,603 |
54,044 |
24,315 |
29,729 |
6,732 |
5,857 |
875 |
|
1985 |
62,268 |
29,024 |
33,244 |
55,778 |
23,465 |
32,313 |
6,491 |
5,559 |
931 |
|
1986 |
63,290 |
28,670 |
34,620 |
56,723 |
23,270 |
33,453 |
6,566 |
5,400 |
1,167 |
|
1987 |
63,392 |
28,432 |
34,959 |
56,846 |
23,170 |
33,676 |
6,546 |
5,262 |
1,284 |
|
1988 |
62,142 |
28,081 |
34,062 |
55,464 |
22,867 |
32,596 |
6,678 |
5,213 |
1,465 |
|
1989 |
61,294 |
27,304 |
33,990 |
54,300 |
21,892 |
32,408 |
6,994 |
5,412 |
1,582 |
|
1990 |
61,831 |
6,344 |
5,488 |
55,409 |
21,386 |
34,022 |
6,422 |
4,957 |
1,465 |
|
1991 |
61,517 |
25,747 |
35,771 |
55,048 |
20,833 |
34,215 |
6,469 |
4,914 |
1,555 |
|
1992 |
64,231 |
25,362 |
38,868 |
57,940 |
20,771 |
37,170 |
6,290 |
4,592 |
1,699 |
|
1993 |
64,746 |
25,127 |
39,619 |
58,596 |
20,670 |
37,926 |
6,150 |
4,458 |
1,692 |
|
1994 |
64,972 |
24,615 |
40,357 |
58,889 |
20,215 |
38,674 |
6,083 |
4,400 |
1,682 |
|
1995 |
66,193 |
23,531 |
42,662 |
9,894 |
19,005 |
40,889 |
6,299 |
4,525 |
1,773 |
|
1996 |
67,888 |
23,262 |
44,625 |
61,417 |
18,681 |
42,736 |
6,470 |
4,581 |
1,889 |
|
1997 |
70,724 |
22,745 |
47,979 |
64,088 |
18,118 |
45,970 |
6,637 |
4,628 |
2,009 |
Footnotes
- Includes single employer plans, plans of controlled groups of corporations, and multiple-employer noncollectively bargained plans.
- Includes multiemployer plans and multiple-employer collectively bargained plans.
Note: The number of participants includes double counting of workers in more than one plan.
Source: Form 5500 series reports filed with the Internal Revenue Service for 1978-97 plan years.
|
Year |
Total Plans |
Total Plans |
Total Plans |
Single Employer Plans (1) |
Single Employer Plans (1) |
Single Employer Plans (1) |
Multiemployer Plans (2) |
Multiemployer Plans (2) |
Multiemployer Plans (2) |
|---|---|---|---|---|---|---|---|---|---|
|
1978 |
4,934 |
1,675 |
3,259 |
4,918 |
1,668 |
3,250 |
16 |
7 |
9 |
|
1979 |
5,103 |
1,641 |
3,462 |
5,087 |
1,632 |
3,455 |
16 |
8 |
7 |
|
1980 |
5,406 |
1,828 |
3,578 |
5,392 |
1,816 |
3,576 |
14 |
12 |
2 |
|
1981 |
5,996 |
1,957 |
4,039 |
5,982 |
1,952 |
4,031 |
14 |
5 |
8 |
|
1982 |
6,463 |
1,974 |
4,489 |
6,447 |
1,966 |
4,481 |
16 |
8 |
8 |
|
1983 |
6,381 |
1,861 |
4,520 |
6,365 |
1,852 |
4,513 |
15 |
9 |
6 |
|
1984 |
6,591 |
1,841 |
4,750 |
6,576 |
1,831 |
4,745 |
16 |
11 |
5 |
|
1985 |
7,227 |
1,880 |
5,348 |
7,213 |
1,874 |
5,340 |
14 |
6 |
8 |
|
1986 |
7,583 |
1,849 |
5,734 |
7,573 |
1,843 |
5,731 |
10 |
7 |
3 |
|
1987 |
7,793 |
1,672 |
6,121 |
7,778 |
1,666 |
6,113 |
15 |
6 |
8 |
|
1988 |
7,715 |
1,525 |
6,189 |
7,699 |
1,519 |
6,180 |
16 |
6 |
10 |
|
1989 |
8,033 |
1,301 |
6,731 |
8,022 |
1,297 |
6,725 |
11 |
4 |
7 |
|
1990 |
7,944 |
1,162 |
6,783 |
7,928 |
1,158 |
6,770 |
16 |
4 |
13 |
|
1991 |
8,183 |
1,114 |
7,069 |
8,167 |
1,107 |
7,061 |
16 |
7 |
9 |
|
1992 |
7,707 |
1,022 |
7,685 |
8,692 |
1,019 |
7,673 |
15 |
4 |
12 |
|
1993 |
8,727 |
935 |
7,792 |
8,709 |
930 |
7,779 |
18 |
5 |
13 |
|
1994 |
8,790 |
856 |
7,935 |
8,771 |
847 |
7,924 |
19 |
9 |
10 |
|
1995 |
8,992 |
806 |
8,186 |
8,979 |
804 |
8,175 |
13 |
2 |
11 |
|
1996 |
9,182 |
717 |
8,465 |
9,163 |
712 |
8,450 |
19 |
4 |
15 |
|
1997 |
9,866 |
660 |
9,206 |
9,848 |
655 |
9,194 |
18 |
5 |
13 |
Footnotes
- Includes single employer plans, plans of controlled groups of corporations, and multiple-employer noncollectively bargained plans.
- Includes multiemployer plans and multiple-employer collectively bargained plans.
Note: The number of participants inculdes double counting of workers in more than one plan.
Source: Form 5500 series reports filed with the Internal Revenue Service for 1978-97 plan years.
|
Year |
Total Plans |
Total Plans |
Total Plans |
Single Employer Plans (1) |
Single Employer Plans (1) |
Single Employer Plans (1) |
Multiemployer Plans (2) |
Multiemployer Plans (2) |
Multiemployer Plans (2) |
|---|---|---|---|---|---|---|---|---|---|
|
1978 |
39,730 |
27,361 |
12,369 |
32,798 |
20,765 |
12,033 |
6,931 |
6,596 |
335 |
|
1979 |
41,826 |
27,779 |
14,027 |
34,712 |
21,125 |
13,586 |
7,115 |
6,675 |
440 |
|
1980 |
43,620 |
28,305 |
15,315 |
36,687 |
21,889 |
14,798 |
6,933 |
6,416 |
517 |
|
1981 |
44,830 |
28,125 |
16,704 |
37,839 |
21,749 |
16,090 |
6,991 |
6,376 |
615 |
|
1982 |
46,741 |
27,782 |
18,959 |
39,897 |
21,664 |
18,233 |
6,844 |
6,118 |
726 |
|
1983 |
51,428 |
28,104 |
23,324 |
44,546 |
22,025 |
22,520 |
6,882 |
6,078 |
804 |
|
1984 |
54,184 |
28,331 |
25,853 |
47,468 |
22,484 |
24,984 |
6,716 |
5,846 |
870 |
|
1985 |
55,041 |
27,145 |
27,896 |
48,564 |
21,591 |
26,973 |
6,476 |
5,553 |
923 |
|
1986 |
55,706 |
26,820 |
28,886 |
49,150 |
21,427 |
27,723 |
6,556 |
5,393 |
1,163 |
|
1987 |
55,599 |
26,760 |
28,838 |
49,067 |
21,504 |
27,563 |
6,531 |
5,256 |
1,275 |
|
1988 |
54,428 |
26,555 |
27,872 |
47,765 |
21,348 |
26,417 |
6,663 |
5,207 |
1,456 |
|
1989 |
53,262 |
26,004 |
27,258 |
46,278 |
20,595 |
25,683 |
6,983 |
5,409 |
1,574 |
|
1990 |
53,887 |
25,182 |
28,705 |
47,481 |
20,228 |
27,252 |
6,406 |
4,954 |
1,453 |
|
1991 |
53,334 |
24,633 |
28,701 |
46,881 |
19,726 |
27,155 |
6,453 |
4,907 |
1,546 |
|
1992 |
55,224 |
24,340 |
31,184 |
49,249 |
19,752 |
29,497 |
6,275 |
4,588 |
1,687 |
|
1993 |
56,019 |
24,192 |
31,827 |
49,887 |
19,739 |
30,148 |
6,132 |
4,453 |
1,679 |
|
1994 |
56,181 |
23,759 |
32,422 |
50,118 |
19,368 |
30,750 |
6,064 |
4,392 |
1,672 |
|
1995 |
57,201 |
22,724 |
34,477 |
50,916 |
18,202 |
32,714 |
6,285 |
4,523 |
1,762 |
|
1996 |
58,706 |
22,546 |
36,160 |
52,255 |
17,968 |
34,286 |
6,451 |
4,577 |
1,873 |
|
1997 |
60,858 |
22.085 |
38.773 |
54,239 |
17,463 |
36,776 |
6,619 |
4,622 |
1,997 |
Footnotes
- Includes single employer plans, plans of controlled groups of corporations, and multiple-employer noncollectively bargained plans.
- Includes multiemployer plans and multiple-employer collectively bargained plans.
Note: The number of participants includes double counting of workers in more than one plan.
Source: Form 5500 series reports filed with the Internal Revenue Service for 1978-97 plan years.
|
Year |
Total Plans |
Total Plans |
Total Plans |
Single Employer Plans (2) |
Single Employer Plans (2) |
Single Employer Plans (2) |
Multiemployer Plans (3) |
Multiemployer Plans (3) |
Multiemployer Plans (3) |
|---|---|---|---|---|---|---|---|---|---|
|
1978 |
$377,195 |
$272,684 |
$104,511 |
$343,183 |
$239,884 |
$103,299 |
$34,012 |
$32,800 |
$1,211 |
|
1979 |
445,430 |
319,595 |
125,835 |
404,724 |
280,326 |
124,398 |
40,706 |
39,269 |
1,437 |
|
1980 |
563,551 |
401,455 |
162,096 |
514,583 |
353,967 |
160,616 |
48,968 |
47,488 |
1,480 |
|
1981 |
628,916 |
444,376 |
184,540 |
572,101 |
389,846 |
182,615 |
56,814 |
54,890 |
1,924 |
|
1982 |
788,987 |
553,419 |
235,567 |
716,281 |
483,536 |
232,744 |
72,706 |
69,883 |
2,823 |
|
1983 |
923,470 |
642,359 |
281,111 |
843,693 |
566,369 |
277,323 |
79,777 |
75,990 |
3,788 |
|
1984 |
1,044,592 |
700,669 |
343,922 |
947,373 |
608,703 |
338,670 |
97,212 |
91,966 |
5,246 |
|
1985 |
1,252,739 |
826,117 |
426,622 |
1,136,417 |
716,107 |
420,310 |
116,322 |
110,010 |
6,312 |
|
1986 |
1,382,910 |
895,073 |
487,837 |
1,251,034 |
772,205 |
478,830 |
131,876 |
122,868 |
9,008 |
|
1987 |
1,402,488 |
877,269 |
525,219 |
1,266,694 |
751,475 |
515,219 |
135,794 |
125,794 |
10,000 |
|
1988 |
1,503,635 |
911,982 |
591,653 |
1,351,845 |
772,381 |
579,464 |
151,790 |
139,601 |
12,189 |
|
1989 |
1,675,597 |
987,971 |
687,626 |
1,505,319 |
832,148 |
673,171 |
170,278 |
155,822 |
14,455 |
|
1990 |
1,674,139 |
961,904 |
712,236 |
1,496,300 |
798,167 |
698,133 |
177,839 |
163,737 |
14,102 |
|
1991 |
1,936,271 |
1,101,987 |
834,284 |
1,743,190 |
926,424 |
816,766 |
193,080 |
175,562 |
17,518 |
|
1992 |
2,094,087 |
1,146,798 |
947,289 |
1,879,033 |
955,621 |
923,412 |
215,053 |
191,177 |
23,877 |
|
1993 |
2,316,272 |
1,248,180 |
1,068,092 |
2,091,468 |
1,049,915 |
1,041,553 |
224,804 |
198,265 |
26,540 |
|
1994 |
2,298,556 |
1,210,856 |
1,087,700 |
2,070,804 |
1,010,275 |
1,060,529 |
227,752 |
200,581 |
27,171 |
|
1995 |
2,723,735 |
1,402,079 |
1,321,657 |
2,458,153 |
1,163,416 |
1,294,737 |
265,582 |
238,663 |
26,920 |
|
1996 |
3,136,281 |
1,585,397 |
1,550,884 |
2,837,125 |
1,316,599 |
1,520,526 |
299,156 |
268,798 |
30,358 |
|
1997 |
3,553,757 |
1,735,604 |
1,818,152 |
3,213,304 |
1,432,788 |
1,780,516 |
340,452 |
302,816 |
37,636 |
Footnotes
- Asset amounts shown exclude funds held by life insurance companies under allocated group insurance contracts for payment of retirement benefits. These excluded funds make up roughly 10 to 15 percent of total private fund assets.
- Includes single employer plans, plans of controlled groups of corporations, and multiple-employer noncollectively bargained plans.
- Includes multiemployer plans and multiple-employer collectively bargained plans.
Source: Form 5500 series reports filed with the Internal Revenue Service for 1978-97 plan years.
|
Year |
Total Plans |
Total Plans |
Total Plans |
Single Employer Plans (2) |
Single Employer Plans (2) |
Single Employer Plans (2) |
Multiemployer Plans (3) |
Multiemployer Plans (3) |
Multiemployer Plans (3) |
|---|---|---|---|---|---|---|---|---|---|
|
1978 |
$52,023 |
$15,661 |
$36,362 |
$51,727 |
$15,471 |
$36,255 |
$297 |
$190 |
$106 |
|
1979 |
64,021 |
19,498 |
44,523 |
63,725 |
19,271 |
44,453 |
296 |
227 |
69 |
|
1980 |
86,785 |
31,498 |
55,287 |
86,101 |
30,872 |
55,229 |
684 |
626 |
58 |
|
1981 |
104,006 |
38,792 |
65,214 |
103,220 |
38,081 |
65,139 |
785 |
711 |
74 |
|
1982 |
129,263 |
46,971 |
82,292 |
128,895 |
46,649 |
82,246 |
369 |
323 |
46 |
|
1983 |
155,214 |
60,594 |
94,620 |
154,626 |
60,064 |
94,562 |
58 |
530 |
58 |
|
1984 |
176,847 |
62,904 |
113,943 |
176,103 |
62,231 |
113,873 |
743 |
673 |
70 |
|
1985 |
211,665 |
67,745 |
143,920 |
210,666 |
66,878 |
143,789 |
999 |
867 |
132 |
|
1986 |
232,718 |
66,276 |
166,442 |
231,481 |
65,132 |
166,350 |
1,237 |
1,143 |
93 |
|
1987 |
228,244 |
65,232 |
163,012 |
227,048 |
64,277 |
162,771 |
1,196 |
955 |
241 |
|
1988 |
240,867 |
54,652 |
186,215 |
239,393 |
53,389 |
186,004 |
1,474 |
1,263 |
211 |
|
1989 |
236,459 |
44,570 |
191,889 |
236,016 |
44,243 |
191,773 |
443 |
327 |
116 |
|
1990 |
242,068 |
44,192 |
197,876 |
241,224 |
43,599 |
197,624 |
844 |
592 |
252 |
|
1991 |
264,329 |
40,161 |
224,168 |
263,967 |
40,033 |
223,934 |
362 |
128 |
234 |
|
1992 |
261,359 |
30,396 |
230,963 |
260,922 |
30,199 |
230,723 |
437 |
197 |
239 |
|
1993 |
291,912 |
33,166 |
258,746 |
291,238 |
32,770 |
258,468 |
675 |
396 |
278 |
|
1994 |
278,555 |
25,384 |
253,171 |
277,644 |
24,687 |
252,958 |
911 |
698 |
213 |
|
1995 |
323,751 |
26,455 |
297,295 |
323,066 |
26,210 |
296,855 |
685 |
245 |
440 |
|
1996 |
359,984 |
28,576 |
331,407 |
358,874 |
27,870 |
331,005 |
1,110 |
707 |
403 |
|
1997 |
398,775 |
25,614 |
373,161 |
397,474 |
24,876 |
372,598 |
1,302 |
738 |
563 |
Footnotes
- Asset amounts shown exclude funds held by life insurance companies under allocated group insurance contracts for payment of retirement benefits. These excluded funds make up roughly 10 to 15 percent of total private fund assets.
- Includes single employer plans, plans of controlled groups of corporations, and multiple-employer noncollectively bargained plans.
- Includes multiemployer plans and multiple-employer collectively bargained plans.
Source: Form 5500 series reports filed with the Internal Revenue Service for 1978-97 plan years.
|
Year |
Total Plans |
Total Plans |
Total Plans |
Single Employer Plans (2) |
Single Employer Plans (2) |
Single Employer Plans (2) |
Multiemployer Plans (3) |
Multiemployer Plans (3) |
Multiemployer Plans (3) |
|---|---|---|---|---|---|---|---|---|---|
|
1978 |
$325,172 |
$257,023 |
$68,149 |
$291,456 |
$224,413 |
$67,044 |
$33,715 |
$32,610 |
$1,105 |
|
1979 |
381,409 |
300,097 |
81,312 |
340,999 |
261,055 |
79,945 |
40,410 |
39,042 |
1,368 |
|
1980 |
476,766 |
369,957 |
106,809 |
428,482 |
323,095 |
105,387 |
48,284 |
46,862 |
1,422 |
|
1981 |
524,910 |
405,584 |
119,326 |
468,881 |
351,405 |
117,476 |
56,029 |
54,179 |
1,850 |
|
1982 |
659,724 |
506,448 |
153,276 |
587,386 |
436,887 |
150,499 |
72,337 |
69,560 |
2,777 |
|
1983 |
768,256 |
581,765 |
186,491 |
689,066 |
506,305 |
182,761 |
79,190 |
75,460 |
3,730 |
|
1984 |
867,745 |
637,765 |
229,979 |
771,270 |
546,472 |
224,797 |
96,469 |
91,293 |
5,176 |
|
1985 |
1,041,074 |
758,372 |
282,702 |
925,751 |
649,229 |
276,521 |
115,523 |
109,143 |
6,180 |
|
1986 |
1,150,192 |
828,797 |
321,395 |
1,019,553 |
707,073 |
312,480 |
130,639 |
121,725 |
8,915 |
|
1987 |
1,174,244 |
812,037 |
362,207 |
1,039,646 |
687,198 |
352,448 |
134,598 |
124,839 |
9,759 |
|
1988 |
1,262,768 |
857,330 |
405,438 |
1,112,452 |
718,992 |
393,460 |
150,316 |
138,338 |
11,978 |
|
1989 |
1,439,138 |
943,401 |
495,737 |
1,269,303 |
787,905 |
481,398 |
169,835 |
155,496 |
14,339 |
|
1990 |
1,432,072 |
917,712 |
514,360 |
1,255,076 |
754,567 |
500,509 |
176,995 |
163,145 |
13,851 |
|
1991 |
1,671,942 |
1,061,826 |
610,116 |
1,479,224 |
886,391 |
592,832 |
192,718 |
175,434 |
17,284 |
|
1992 |
1,832,728 |
1,116,401 |
716,326 |
1,618,111 |
925,422 |
692,689 |
214,617 |
190,979 |
23,637 |
|
1993 |
2,024,360 |
1,215,014 |
809,346 |
1,800,230 |
1,017,145 |
783,085 |
224,130 |
197,869 |
26,261 |
|
1994 |
2,020,001 |
1,185,471 |
834,529 |
1,793,159 |
985,588 |
807,572 |
226,841 |
199,884 |
26,958 |
|
1995 |
2,399,984 |
1,375,623 |
1,024,361 |
2,135,087 |
1,137,206 |
997,881 |
264,897 |
238,417 |
26,480 |
|
1996 |
2,776,297 |
1,556,821 |
1,219,476 |
2,478,251 |
1,288,729 |
1,189,521 |
298,047 |
268,092 |
29,955 |
|
1997 |
3,154,982 |
1,709,990 |
1,444,991 |
2,815,831 |
1,407,912 |
1,407,919 |
339,151 |
302,078 |
37,072 |
Footnotes
- Asset amounts shown exclude funds held by life insurance companies under allocated group insurance contracts for payment of retirement benefits. These excluded funds make up roughly 10 to 15 percent of total private fund assets.
- Includes single employer plans, plans of controlled groups of corporations and multiple-employer noncollectively bargained plans.
- Includes multiemployer plans and multiple-employer collectively bargained plans.
Source: Form 5500 series reports filed with the Internal Revenue Service for 1978-97 plan years.
|
Year |
Total Plans |
Total Plans |
Total Plans |
Single Employer Plans (1) |
Single Employer Plans (1) |
Single Employer Plans (1) |
Multiemployer Plans (2) |
Multiemployer Plans (2) |
Multiemployer Plans (2) |
|---|---|---|---|---|---|---|---|---|---|
|
1978 |
$55,943 |
$37,591 |
$18,353 |
$49,793 |
$31,602 |
$18,191 |
$6,151 |
$5,989 |
$162 |
|
1979 |
61,279 |
40,585 |
20,694 |
54,217 |
33,738 |
20,479 |
7,061 |
6,847 |
214 |
|
1980 |
66,157 |
42,626 |
23,531 |
58,718 |
35,524 |
23,194 |
7,439 |
7,102 |
337 |
|
1981 |
75,374 |
46,985 |
28,389 |
67,191 |
39,187 |
28,004 |
8,183 |
7,798 |
385 |
|
1982 |
79,502 |
48,438 |
31,064 |
71,320 |
40,807 |
30,513 |
8,182 |
7,631 |
551 |
|
1983 |
82,447 |
46,313 |
36,134 |
74,022 |
38,677 |
35,345 |
8,425 |
7,636 |
789 |
|
1984 |
90,625 |
47,197 |
43,428 |
81,553 |
38,990 |
42,563 |
9,072 |
8,207 |
865 |
|
1985 |
95,188 |
41,996 |
53,192 |
85,927 |
33,794 |
52,133 |
9,261 |
8,202 |
1,059 |
|
1986 |
91,503 |
33,161 |
58,342 |
82,190 |
25,142 |
57,049 |
9,313 |
8,020 |
1,293 |
|
1987 |
92,070 |
29,793 |
62,277 |
82,834 |
21,993 |
60,841 |
9,235 |
7,800 |
1,436 |
|
1988 |
91,248 |
26,300 |
64,948 |
81,612 |
18,352 |
63,261 |
9,636 |
7,948 |
1,688 |
|
1989 |
97,920 |
24,723 |
73,197 |
88,049 |
16,684 |
71,365 |
9,871 |
8,039 |
1,832 |
|
1990 |
98,792 |
23,026 |
75,766 |
89,834 |
15,709 |
74,125 |
8,958 |
7,317 |
1,641 |
|
1991 |
111,124 |
30,146 |
80,978 |
102,224 |
22,952 |
79,272 |
8,899 |
7,194 |
1,705 |
|
1992 |
128,795 |
35,174 |
93,621 |
119,682 |
27,964 |
91,718 |
9,114 |
7,210 |
1,904 |
|
1993 |
153,642 |
52,123 |
101,519 |
143,944 |
44,521 |
99,423 |
9,698 |
7,602 |
2,096 |
|
1994 |
144,353 |
39,031 |
105,322 |
133,844 |
30,829 |
103,015 |
10,509 |
8,203 |
2,307 |
|
1995 |
158,832 |
41,423 |
117,409 |
147,621 |
32,600 |
115,021 |
11,210 |
8,823 |
2,387 |
|
1996 |
169,540 |
35,803 |
133,737 |
157,204 |
26,174 |
131,030 |
12,335 |
9,629 |
2,707 |
|
1997 |
177,940 |
29,862 |
148,078 |
164,633 |
19,723 |
144,909 |
13,307 |
10,138 |
3,169 |
Footnotes
- Includes single employer plans, plans of controlled groups of corporations, and multiple-employer noncollectively bargained plans.
- Includes multiemployer plans and multiple-employer collectively bargained plans.
Note: Includes both employer and employee contributions.
Source: Form 5500 series reports filed with the Internal Revenue Service for 1978-97 plan years.
|
Year |
Total Plans |
Total Plans |
Total Plans |
Single Employer Plans (1) |
Single Employer Plans (1) |
Single Employer Plans (1) |
Multiemployer Plans (2) |
Multiemployer Plans (2) |
Multiemployer Plans (2) |
|---|---|---|---|---|---|---|---|---|---|
|
1978 |
$9,644 |
$3,303 |
$6,342 |
$9,602 |
$3,271 |
$6,330 |
$43 |
$31 |
$12 |
|
1979 |
11,542 |
4,323 |
7,219 |
11,495 |
4,290 |
7,205 |
46 |
33 |
13 |
|
1980 |
13,545 |
5,870 |
7,675 |
13,490 |
5,830 |
7,660 |
55 |
40 |
15 |
|
1981 |
16,406 |
7,163 |
9,242 |
16,304 |
7,079 |
9,225 |
101 |
84 |
17 |
|
1982 |
16,094 |
7,672 |
9,422 |
16,047 |
7,641 |
9,406 |
47 |
31 |
16 |
|
1983 |
17,357 |
7,593 |
9,764 |
17,288 |
7,537 |
9,751 |
69 |
56 |
13 |
|
1984 |
18,561 |
7,850 |
10,712 |
18,487 |
7,788 |
10,700 |
74 |
62 |
12 |
|
1985 |
21,575 |
7,404 |
14,171 |
21,489 |
7,339 |
14,150 |
86 |
65 |
21 |
|
1986 |
21,543 |
5,659 |
15,884 |
21,475 |
5,607 |
15,868 |
68 |
52 |
16 |
|
1987 |
19,963 |
4,296 |
15,667 |
19,895 |
4,239 |
15,656 |
67 |
57 |
11 |
|
1988 |
18,964 |
3,015 |
15,948 |
18,909 |
2,981 |
15,929 |
54 |
34 |
20 |
|
1989 |
20,995 |
2,763 |
18,232 |
20,961 |
2,742 |
18,219 |
34 |
21 |
13 |
|
1990 |
21,687 |
2,608 |
19,079 |
21,642 |
2,590 |
19,052 |
44 |
18 |
26 |
|
1991 |
21,908 |
2,420 |
19,488 |
21,881 |
2,413 |
19,468 |
27 |
7 |
21 |
|
1992 |
25,214 |
2,229 |
22,985 |
25,185 |
2,223 |
22,962 |
29 |
6 |
23 |
|
1993 |
25,959 |
2,451 |
23,508 |
25,904 |
2,418 |
23,486 |
55 |
33 |
22 |
|
1994 |
23,933 |
1,918 |
22,015 |
23,688 |
1,693 |
21,995 |
245 |
225 |
20 |
|
1995 |
28,150 |
2,406 |
25,744 |
28,111 |
2,392 |
25,719 |
39 |
14 |
25 |
|
1996 |
30,802 |
1,943 |
28,860 |
30,742 |
1,911 |
28,830 |
60 |
31 |
29 |
|
1997 |
34,285 |
1,977 |
32,309 |
34,204 |
1,936 |
32,268 |
81 |
41 |
40 |
Footnotes
- Includes single employer plans, plans of controlled groups of corporations, and multiple-employer noncollectively bargained plans.
- Includes multiemployer plans and multiple-employer collectively bargained plans.
Note: Includes both employer and employee contributions.
Source: Form 5500 series reports filed with the Internal Revenue Service for 1978-97 plan years.
|
Year |
Total Plans |
Total Plans |
Total Plans |
Single Employer Plans (1) |
Single Employer Plans (1) |
Single Employer Plans (1) |
Multiemployer Plans (2) |
Multiemployer Plans (2) |
Multiemployer Plans (2) |
|---|---|---|---|---|---|---|---|---|---|
|
1978 |
$46,299 |
$34,288 |
$12,010 |
$40,191 |
$28,331 |
$11,861 |
$6,108 |
$5,958 |
$150 |
|
1979 |
49,737 |
36,262 |
13,475 |
42,722 |
29,448 |
13,274 |
7,015 |
6,814 |
201 |
|
1980 |
52,612 |
36,756 |
15,856 |
45,228 |
29,694 |
15,534 |
7,384 |
7,062 |
322 |
|
1981 |
58,968 |
39,822 |
19,147 |
50,887 |
32,108 |
18,779 |
8,082 |
7,714 |
368 |
|
1982 |
62,408 |
40,766 |
21,642 |
54,273 |
33,166 |
21,108 |
8,135 |
7,600 |
535 |
|
1983 |
65,090 |
38,720 |
26,370 |
56,734 |
31,140 |
25,594 |
8,356 |
7,580 |
776 |
|
1984 |
72,064 |
39,347 |
32,717 |
63,066 |
31,203 |
31,863 |
8,997 |
8,145 |
853 |
|
1985 |
73,613 |
34,592 |
39,021 |
64,438 |
26,455 |
37,983 |
9,175 |
8,137 |
1,038 |
|
1986 |
69,960 |
27,502 |
42,458 |
60,715 |
19,535 |
41,180 |
9,245 |
7,968 |
1,277 |
|
1987 |
72,107 |
25,497 |
46,610 |
62,939 |
17,754 |
45,185 |
9,168 |
7,743 |
1,425 |
|
1988 |
72,286 |
23,285 |
49,000 |
62,703 |
15,371 |
47,332 |
9,582 |
7,914 |
1,668 |
|
1989 |
76,925 |
21,960 |
54,965 |
67,088 |
13,942 |
53,146 |
9,837 |
8,018 |
1,819 |
|
1990 |
77,105 |
20,418 |
56,687 |
68,192 |
13,119 |
55,073 |
8,914 |
7,299 |
1,614 |
|
1991 |
89,215 |
27,726 |
61,489 |
80,343 |
20,539 |
59,804 |
8,872 |
7,187 |
1,684 |
|
1992 |
103,581 |
32,945 |
70,636 |
94,497 |
25,741 |
68,756 |
9,084 |
7,204 |
1,880 |
|
1993 |
127,683 |
49,672 |
78,011 |
118,040 |
42,103 |
75,937 |
9,643 |
7,569 |
2,074 |
|
1994 |
120,420 |
37,113 |
83,307 |
110,155 |
29,135 |
81,020 |
10,265 |
7,978 |
2,287 |
|
1995 |
130,682 |
39,017 |
91,665 |
119,510 |
30,208 |
89,302 |
11,172 |
8,809 |
2,363 |
|
1996 |
138,738 |
33,860 |
104,877 |
126,463 |
24,263 |
102,200 |
12,275 |
9,598 |
2,677 |
|
1997 |
143,655 |
27,886 |
115,770 |
130,429 |
17,788 |
112,641 |
13,226 |
10,097 |
3,128 |
Footnotes
- Includes single employer plans, plans of controlled groups of corporations, and multiple-employer noncollectively bargained plans.
- Includes multiemployer plans and multiple-employer collectively bargained plans.
Note: Includes both employer and employee contributions.
Source: Form 5500 series reports filed with the Internal Revenue Service for 1978-97 plan years.
|
Year |
Total Plans |
Total Plans |
Total Plans |
Single Employer Plans (2) |
Single Employer Plans (2) |
Single Employer Plans (2) |
Multiemployer Plans (3) |
Multiemployer Plans (3) |
Multiemployer Plans (3) |
|---|---|---|---|---|---|---|---|---|---|
|
1978 |
$26,516 |
$17,661 |
$8,855 |
$23,333 |
$14,485 |
$8,748 |
$3,283 |
$3,176 |
$108 |
|
1979 |
28,680 |
18,688 |
9,991 |
25,272 |
15,386 |
9,886 |
3,408 |
3,302 |
106 |
|
1980 |
35,280 |
22,148 |
13,132 |
31,485 |
18,524 |
12,961 |
3,795 |
3,624 |
171 |
|
1981 |
44,753 |
27,334 |
17,420 |
40,281 |
22,987 |
17,294 |
4,473 |
4,347 |
125 |
|
1982 |
55,307 |
33,875 |
21,432 |
50,219 |
28,957 |
21,263 |
5,088 |
4,918 |
170 |
|
1983 |
65,333 |
36,976 |
28,357 |
59,547 |
31,507 |
28,040 |
5,786 |
5,469 |
317 |
|
1984 |
79,086 |
46,513 |
32,573 |
72,510 |
40,269 |
32,241 |
6,576 |
6,244 |
332 |
|
1985 |
101,898 |
54,466 |
47,432 |
94,792 |
47,801 |
46,991 |
7,106 |
6,665 |
441 |
|
1986 |
130,483 |
67,974 |
62,509 |
122,613 |
60,612 |
62,000 |
7,870 |
7,361 |
579 |
|
1987 |
122,254 |
66,241 |
56,013 |
113,834 |
58,345 |
55,489 |
8,420 |
7,896 |
524 |
|
1988 |
118,645 |
60,450 |
58,195 |
109,446 |
51,910 |
57,535 |
9,200 |
8,540 |
660 |
|
1989 |
132,049 |
66,707 |
65,342 |
121,750 |
57,236 |
64,514 |
10,299 |
9,471 |
828 |
|
1990 |
129,405 |
66,363 |
63,042 |
118,227 |
56,079 |
62,147 |
11,178 |
10,284 |
894 |
|
1991 |
135,552 |
71,503 |
64,048 |
123,986 |
61,081 |
62,904 |
11,566 |
10,422 |
1,144 |
|
1992 |
152,441 |
77,853 |
74,588 |
139,247 |
66,287 |
72,960 |
13,194 |
11,566 |
1,628 |
|
1993 |
156,305 |
79,093 |
77,212 |
142,471 |
66,847 |
75,625 |
13,834 |
12,246 |
1,587 |
|
1994 |
163,934 |
82,625 |
81,309 |
149,035 |
69,417 |
79,617 |
14,899 |
13,207 |
1,692 |
|
1995 |
183,025 |
85,134 |
97,892 |
167,249 |
70,947 |
96,302 |
15,777 |
14,187 |
1,590 |
|
1996 |
213,399 |
96,914 |
116,485 |
196,224 |
81,436 |
114,788 |
17,176 |
15,478 |
1,698 |
|
1997 |
232,479 |
97,213 |
135,266 |
214,191 |
80,994 |
133,197 |
18,288 |
16,219 |
2,069 |
Footnotes
- Amounts shown include both benefits paid directly from trust funds and premium payments made by plans to insurance carriers. Amounts exclude benefits paid directly by insurance carriers.
- Includes single employer plans, plans of controlled groups of corporations, and multiple-employer noncollectively bargained plans.
- Includes multiemployer plans and multiple-employer collectively bargained plans.
Source: Form 5500 series reports filed with the Internal Revenue Service for 1978-97 plan years.
|
Year |
Total Plans |
Total Plans |
Total Plans |
Single Employer Plans (2) |
Single Employer Plans (2) |
Single Employer Plans (2) |
Multiemployer Plans (3) |
Multiemployer Plans (3) |
Multiemployer Plans (3) |
|---|---|---|---|---|---|---|---|---|---|
|
1978 |
$3,387 |
$1,292 |
$2,095 |
$3,356 |
$1,271 |
$2,085 |
$31 |
$21 |
$10 |
|
1979 |
3,614 |
1,442 |
2,171 |
3,586 |
1,420 |
2,166 |
28 |
23 |
5 |
|
1980 |
5,123 |
2,076 |
3,047 |
5,086 |
2,044 |
3,042 |
37 |
32 |
5 |
|
1981 |
6,991 |
2,789 |
4,203 |
6,940 |
2,740 |
4,200 |
52 |
49 |
2 |
|
1982 |
10,736 |
5,782 |
4,954 |
10,679 |
5,736 |
4,943 |
56 |
46 |
10 |
|
1983 |
11,649 |
4,213 |
7,436 |
11,580 |
4,149 |
7,431 |
70 |
65 |
6 |
|
1984 |
14,311 |
6,290 |
8,021 |
14,237 |
6,225 |
8,012 |
74 |
65 |
9 |
|
1985 |
22,493 |
8,936 |
13,557 |
22,403 |
8,872 |
13,531 |
90 |
63 |
26 |
|
1986 |
38,484 |
14,730 |
24,527 |
38,355 |
14,604 |
23,749 |
129 |
125 |
5 |
|
1987 |
34,584 |
14,796 |
19,788 |
34,425 |
14,665 |
19,760 |
159 |
131 |
28 |
|
1988 |
33,718 |
12,069 |
21,649 |
33,657 |
12,018 |
21,639 |
61 |
51 |
10 |
|
1989 |
37,063 |
12,369 |
24,694 |
36,914 |
12,252 |
24,662 |
149 |
117 |
32 |
|
1990 |
34,238 |
10,798 |
23,439 |
34,098 |
10,737 |
23,361 |
139 |
61 |
78 |
|
1991 |
30,601 |
9,489 |
21,112 |
30,532 |
9,448 |
21,083 |
69 |
41 |
28 |
|
1992 |
30,763 |
7,929 |
22,834 |
30,720 |
7,912 |
22,808 |
43 |
17 |
26 |
|
1993 |
29,230 |
6,660 |
22,570 |
29,129 |
6,582 |
22,547 |
100 |
77 |
23 |
|
1994 |
25,900 |
4,860 |
21,040 |
25,743 |
4,737 |
21,007 |
157 |
124 |
33 |
|
1995 |
33,927 |
7,100 |
26,827 |
33,816 |
7,035 |
26,781 |
111 |
65 |
46 |
|
1996 |
36,376 |
7,057 |
29,320 |
36,247 |
6,965 |
29,282 |
129 |
92 |
37 |
|
1997 |
43,066 |
7,720 |
35,346 |
42,879 |
7,608 |
35,271 |
187 |
112 |
75 |
Footnotes
- Amounts shown include both benefits paid directly from trust funds and premium payments made by plans to insurance carriers. Amounts exclude benefits paid directly by insurance carriers.
- Includes single employer plans, plans of controlled groups of corporations, and multiple-employer noncollectively bargained plans.
- Includes multiemployer plans and multiple-employer collectively bargained plans.
Source: Form 5500 series reports filed with the Internal Revenue Service for 1978-97 plan years.
|
Year |
Total Plans |
Total Plans |
Total Plans |
Single Employer Plans (2) |
Single Employer Plans (2) |
Single Employer Plans (2) |
Multiemployer Plans (3) |
Multiemployer Plans (3) |
Multiemployer Plans (3) |
|---|---|---|---|---|---|---|---|---|---|
|
1978 |
$23,129 |
$16,369 |
$6,760 |
$19,877 |
$13,214 |
$6,663 |
$3,252 |
$3,155 |
$97 |
|
1979 |
25,066 |
17,246 |
7,820 |
21,686 |
13,966 |
7,720 |
3,380 |
3,279 |
101 |
|
1980 |
30,157 |
20,072 |
10,085 |
26,399 |
16,480 |
9,919 |
3,758 |
3,592 |
166 |
|
1981 |
37,762 |
24,545 |
13,217 |
33,341 |
20,247 |
13,094 |
4,421 |
4,298 |
123 |
|
1982 |
44,571 |
28,093 |
16,478 |
39,540 |
23,221 |
16,319 |
5,032 |
4,872 |
160 |
|
1983 |
55,693 |
32,763 |
22,920 |
47,967 |
27,358 |
20,609 |
5,715 |
5,404 |
311 |
|
1984 |
64,775 |
40,223 |
24,552 |
58,273 |
34,044 |
24,229 |
6,502 |
6,179 |
322 |
|
1985 |
79,405 |
45,530 |
33,875 |
72,389 |
38,929 |
33,460 |
7,016 |
6,602 |
415 |
|
1986 |
91,999 |
53,244 |
38,754 |
84,258 |
46,008 |
38,250 |
7,741 |
7,236 |
504 |
|
1987 |
87,680 |
51,445 |
36,225 |
79,409 |
43,680 |
35,729 |
8,262 |
7,765 |
496 |
|
1988 |
84,926 |
48,381 |
36,546 |
75,787 |
39,892 |
35,896 |
9,139 |
8,489 |
650 |
|
1989 |
94,987 |
54,339 |
40,648 |
84,836 |
44,984 |
39,852 |
10,151 |
9,355 |
796 |
|
1990 |
95,167 |
55,564 |
39,603 |
84,128 |
45,342 |
38,786 |
11,039 |
10,222 |
816 |
|
1991 |
104,951 |
62,014 |
42,937 |
93,454 |
51,633 |
41,821 |
11,497 |
10,381 |
1,116 |
|
1992 |
121,678 |
69,924 |
51,755 |
108,527 |
58,374 |
50,153 |
13,151 |
11,549 |
1,602 |
|
1993 |
127,076 |
72,433 |
54,643 |
113,342 |
60,264 |
53,078 |
13,734 |
12,169 |
1,565 |
|
1994 |
138,034 |
77,764 |
60,269 |
123,291 |
64,681 |
58,611 |
14,742 |
13,084 |
1,659 |
|
1995 |
149,099 |
78,034 |
71,065 |
133,433 |
63,912 |
69,521 |
15,666 |
14,122 |
1,544 |
|
1996 |
177,023 |
89,858 |
87,166 |
159,976 |
74,471 |
85,505 |
17,047 |
15,386 |
1,660 |
|
1997 |
198,413 |
89,493 |
99,920 |
171,312 |
73,386 |
97,926 |
18,101 |
16,107 |
1,994 |
Footnotes
- Amounts shown include both benefits paid directly from trust funds and premium payments made by plans to insurance carriers. Amounts exclude benefits paid directly by insurance carriers.
- Includes single employer plans, plans of controlled groups of corporations, and multiple-employer noncollectively bargained plans.
- Includes multiemployer plans and multiple-employer collectively bargained plans.
Source: Form 5500 series reports filed with the Internal Revenue Service for 1978-97 plan years.
Source: Form 5500 series reports filed with the Internal Revenue Service for 1978-97 plan years.
Source: Form 5500 series reports filed with the Internal Revenue Service for 1978-97 plan years.
Source: Form 5500 series reports filed with the Internal Revenue Service for 1978-97 plan years.
Source: Form 5500 series reports filed with the Internal Revenue Service for 1984-97 plan years.
|
Year(1) |
Total Plans |
Total Plans |
Total Plans |
Single Employer |
Single Employer |
Single Employer |
Multiemployer |
Multiemployer |
Multiemployer |
Total 401(k) |
Total ESOP |
|---|---|---|---|---|---|---|---|---|---|---|---|
|
1985 |
19.6% |
20.1% |
18.4% |
20.0% |
20.6% |
18.5% |
16.8% |
17.0% |
12.7% |
n/a |
n/a |
|
1986 |
13.9 |
14.1 |
13.3 |
14.1 |
14.4 |
13.4 |
12.5 |
12.6 |
10.3 |
n/a |
n/a |
|
1987 |
4.6 |
4.4 |
4.8 |
4.7 |
4.6 |
4.8 |
3.7 |
3.5 |
6.4 |
n/a |
n/a |
|
1988 |
12.4 |
12.1 |
13.1 |
12.6 |
12.2 |
13.2 |
11.6 |
11.8 |
9.5 |
n/a |
n/a |
|
1989 |
11.2 |
12.1 |
9.4 |
11.9 |
13.2 |
9.7 |
6.0 |
6.4 |
1.8 |
n/a |
n/a |
|
1990 |
3.5 |
3.5 |
3.5 |
3.1 |
2.8 |
3.4 |
6.8 |
6.7 |
7.4 |
3.6 |
-1.3 |
|
1991 |
17.5 |
18.8 |
15.1 |
17.8 |
19.6 |
15.2 |
14.9 |
15.2 |
12.0 |
14.7 |
14.7 |
|
1992 |
8.8 |
8.3 |
9.8 |
8.8 |
8.0 |
9.8 |
9.3 |
9.4 |
8.7 |
10.3 |
13.4 |
|
1993 |
10.2 |
10.5 |
9.8 |
10.6 |
11.1 |
9.9 |
7.4 |
7.5 |
6.2 |
9.8 |
12.8 |
|
1994 |
2.9 |
2.2 |
3.8 |
2.7 |
1.8 |
3.8 |
4.4 |
4.5 |
3.9 |
3.7 |
4.1 |
|
1995 |
20.8 |
21.4 |
20.0 |
21.0 |
21.6 |
20.3 |
19.5 |
20.5 |
11.8 |
20.5 |
22.9 |
|
1996 |
14.9 |
14.8 |
15.0 |
15.0 |
14.9 |
15.2 |
13.8 |
14.3 |
9.6 |
14.8 |
18.4 |
|
1997 |
17.9 |
16.8 |
19.3 |
18.0 |
16.6 |
19.5 |
17.1 |
17.5 |
13.6 |
18.2 |
17.0 |
|
Geometric mean(2) |
|||||||||||
|
1985-97 |
12.0 |
12.1 |
11.8 |
12.2 |
12.2 |
11.9 |
10.9 |
11.2 |
8.7 |
n/a |
n/a |
|
1993-97 |
13.2 |
13.0 |
13.4 |
13.3 |
13.0 |
13.6 |
12.3 |
12.7 |
9.0 |
11.7 |
14.1 |
|
1995-97 |
17.9 |
17.6 |
18.1 |
18.0 |
17.7 |
18.3 |
16.8 |
17.4 |
11.6 |
12.8 |
14.8 |
|
Standard deviation(3) |
|||||||||||
|
1985-97 |
5.8 |
6.0 |
5.5 |
5.9 |
6.3 |
5.5 |
5.0 |
5.2 |
3.4 |
n/a |
n/a |
|
1993-97 |
6.3 |
6.5 |
6.1 |
6.4 |
6.6 |
6.2 |
5.7 |
6.0 |
3.5 |
5.6 |
6.3 |
|
1995-97 |
2.4 |
2.8 |
2.2 |
2.4 |
2.8 |
2.2 |
2.3 |
2.5 |
1.7 |
7.0 |
8.0 |
Footnotes
- The 1994 row, for example, represents all plan years that began in 1994. About 77 percent of these plan years began on January 1, 1994.
- Geometric mean computed by adding one to the aggregate rate of return for each of the n years, taking the product of the sums, and taking the nth root of the product, and subtracting one.
- Standard deviation formula uses a denominator definition of n, not n-1.
Note: Rates of return have been derived directly from tables C4-C11 and from similar published summary tables for prior years. The rate of return formula is the same as that described in Chapter 12 of the 1989 DOL volume entitled "Trends in Pensions," except that the return formula used here refines the treatment of receivables. The receivable line item called "income receivables, which first appeared on the 1988 form, is not deducted from total assets because such assets may produce investment income. The formula makes no adjustment for reporting periods other than one year, which are reported on approximately 3 percent of Form 5500 filings. Because the form 5500 does not provide information on the timing of cash flows during the year, a time weighted rate of return cannot be derived. The formula used assumes that all cash flows occur in the middle of the plan's reporting period. The cash flow for which this assumption is most uncertain is contributions. The overall 1994 rate of return reported as 2.9 percent could be as low as 2.80 percent or as high as 2.98 percent depending on the assumption regarding the timing of contributions during the year. The overall 1995 rate of return reported as 20.8 percent could be as low as 20.15 percent or as high as 21.53 percent.
Source: Form 5500 series reports filed with the Internal Revenue Service for 1985-97 plan years.
|
Year |
Average Investable(1) Assets |
Investment Income(2) |
Appreciation |
Appreciation |
Appreciation |
Total DFE(3) Income |
Total(4) |
Total Rate of Return(5) |
Growth of Average Investable Assets(6) |
|---|---|---|---|---|---|---|---|---|---|
|
1985 |
$852,433 |
$49,936 |
$41,170 |
$68,007 |
$109,177 |
$8,042 |
$167,155 |
19.6% |
- |
|
1986 |
1,007,303 |
55,572 |
65,830 |
15,924 |
81,754 |
2,922 |
140,248 |
13.9 |
18.2% |
|
1987 |
1,118,764 |
58,359 |
49,825 |
-58,758 |
-8,933 |
1,511 |
50,937 |
4.6 |
11.1 |
|
1988 |
1,135,950 |
47,509 |
13,609 |
30,597 |
44,206 |
49,613 |
141,328 |
12.4 |
1.5 |
|
1989 |
1,268,455 |
12,484 |
23,197 |
38,963 |
62,160 |
67,305 |
141,949 |
11.2 |
11.7 |
|
1990 |
1,395,262 |
49,855 |
1,995 |
-16,810 |
-14,815 |
13,866 |
48,906 |
3.5 |
10.0 |
|
1991 |
1,411,538 |
49,457 |
15,435 |
73,766 |
89,201 |
108,288 |
246,946 |
17.5 |
1.2 |
|
1992 |
1,658,785 |
45,325 |
9,126 |
30,378 |
39,504 |
61,706 |
146,535 |
8.8 |
17.5 |
|
1993 |
1,808,728 |
45,340 |
15,142 |
30,099 |
45,241 |
93,800 |
184,381 |
10.2 |
9.0 |
|
1994 |
1,961,820 |
43,012 |
1,871 |
-10,567 |
-8,696 |
22,283 |
56,599 |
2.9 |
8.5 |
|
1995 |
1,975,258 |
48,331 |
32,145 |
120,317 |
152,462 |
210,447 |
411,240 |
20.8 |
0.7 |
|
1996 |
2,383,830 |
50,844 |
27,349 |
87,761 |
115,110 |
189,439 |
355,393 |
14.9 |
20.7 |
|
1997 |
2,699,052 |
53,862 |
51,788 |
122,825 |
174,613 |
254,663 |
483,138 |
17.9 |
13.2 |
|
Geometric mean(7) |
|
|
|
|
|
|
|
12.0 |
10.1 |
Footnotes
- Average of beginning-of-year and end-of-year levels of all assets except contributions receivable and value of buildings and other property used in plan operations minus one-half of total return.
- Sum of interest, dividends, rents, and (for years 1985-87) royalties.
- DFE means direct filing entities including common/collective trusts, pooled separate accounts, master trusts, 103-12 investment entities, and registered investment companies.
- Sum of investment income, total appreciation, and total DFE income.
- Total return as a percentage of average investable assets. See note for previous table.
- Percentage increase in average investable assets (column 1) from previous year to current year.
- The geometric mean computed by adding one to the percentage change for each of the n years, taking the product of the sums, taking the nth root of the product, and subtracting one.
Source: Form 5500 series reports filed with the Internal Revenue Service for 1985-97 plan years.
|
Year |
401(k) Plans |
401(k) Plans |
401(k) Plans |
Employee Stock Ownership Plans |
Employee Stock Ownership Plans |
Employee Stock Ownership Plans |
|---|---|---|---|---|---|---|
|
1990 |
3.6% |
4.5% |
3.5% |
-1.3% |
-1.0% |
-1.5% |
|
1991 |
14.7 |
14.6 |
14.7 |
14.7 |
18.9 |
12.6 |
|
1992 |
10.3 |
9.0 |
10.5 |
13.4 |
15.1 |
12.3 |
|
1993 |
9.8 |
8.8 |
10.0 |
12.8 |
10.6 |
14.3 |
|
1994 |
3.7 |
3.4 |
3.7 |
4.1 |
4.4 |
4.0 |
|
1995 |
20.5 |
18.5 |
20.9 |
22.9 |
17.5 |
24.7 |
|
1996 |
14.8 |
14.3 |
15.0 |
18.4 |
18.2 |
18.5 |
|
1997 |
19.4 |
18.3 |
19.7 |
23.8 |
24.7 |
23.5 |
|
Geometric mean(3) |
||||||
|
1990-97 |
11.9 |
11.3 |
12.1 |
13.3 |
13.2 |
13.2 |
|
1993-97 |
13.5 |
12.5 |
13.7 |
16.2 |
14.8 |
16.7 |
|
1995-97 |
18.2 |
17.0 |
18.5 |
21.7 |
20.1 |
22.24 |
|
Standard deviation(4) |
||||||
|
1990-97 |
6.0 |
5.5 |
6.1 |
8.1 |
7.9 |
8.4 |
|
1993-97 |
6.3 |
5.8 |
6.4 |
7.3 |
7.0 |
7.5 |
|
1995-97 |
2.4 |
1.9 |
2.6 |
2.4 |
3.2 |
2.7 |
Footnotes
- 401(k) plan is only plan sponsored by the employer.
- Employer sponsoring 401(k) plan also sponsors other pension plan(s).
- Computed by adding one to the aggregate rate of return for each of the n years, taking the product of the sums, and taking the nth root of the product, and subtracting one.
- Standard deviation formula uses a denominator definition of n, not n-1.
Source: Form 5500 series reports filed with the Internal Revenue Service for 1990-97 plan years.