


Executive Summary
The Pooled Employer Plan bulletin presents data the U.S. Department of Labor (Department) receives on pooled plan providers (PPPs) and pooled employer plans (PEPs). The data submitted to the Department is the primary source of information on PPPs, the services they provide, the coverage and financial information of PEPs, and the employers participating in PEPs. The Department uses this information to support oversight of PPPs and help safeguard the retirement benefits of workers participating in PEPs.
A person or entity that intends to serve as a PPP for a PEP must register using a Form PR.(1) The filer must provide certain information, including identifying information, compliance officials, legal agents, operating PEPs, trustees, and legal status of the PPP or its officials. Filers must update this information as needed in response to changes in PEP offerings and PPP status.
Like other employee benefit plans, PEPs must file a Form 5500 annually to report the number of participants, assets, service providers, and other information to the Department. Beginning with statistical year 2023 filings, PEPs must include a Schedule MEP for specific multiple-employer retirement information. The Schedule MEP identifies participating employers and their estimated share of total plan contributions. For PEPs only, the schedule also includes the aggregate account balance for each employer. PEPs must also provide the unique filing identifier for the most recent Form PR filed by the PEP’s PPP.
This bulletin, the second the Department has produce,(2) presents statistics on PPPs based on Form PR filings submitted through December 31, 2024, and on PEPs based on statistical year 2023 Form 5500 data. The various tables and graphs provide a snapshot of the current universe of PPPs and the PEPs that they sponsor.
Key findings from this bulletin include:
- As of the end of 2024, 167 PPPs had registered with the Department to provide PEPs
- Of the 143 PPPs registered with the Department using the Form PR as of the end of 2023, only 71 (50 percent) reported operating a PEP on a Form 5500 filing for statistical year 2023.
- Although most PPPs operated a single PEP in statistical year 2023, 32 percent operated more than one, including one PPP that operated 26 separate PEPs.
- Of the 269 PEPs that filed a Form 5500 in statistical year 2023, 244 reported participants, assets, or participating employers with account balances.
- In statistical year 2023, PEPs reported 1.2 million total participants, including 484,000 with account balances.
- In statistical year 2023, PEPs held $11.8 billion in retirement plan assets, and the top 1 percent of PEPs, as represented by two plans, held 24 percent of all PEP assets.
- More than 60 percent of PEPs reported 10 or fewer participating employers, while the largest PEP had more than 33,000 participating employers.
Terminology
- ERISA Filing Acceptance System 2 (EFAST2): A web-based system that receives and displays Form 5500 and Form PR filings. All filings for both forms must be submitted to EFAST2.
- Employer Identification Number (EIN): A unique federal tax ID number that the Internal Revenue Service assigns to a business or entity. Several sections of the Form 5500 and Form PR require an EIN.
- Filing year: The year that a form is submitted. In this bulletin, filing year refers to the calendar year when a Form PR was submitted. For example, 2023 filing year includes all Form PR filings submitted during calendar year 2023.
- Form 5500 (Annual Return/Report): An annual report filed by employee benefit plans that contains information on a plan’s assets, contributions, participants, service providers, and insurance contracts, among other attributes. PEPs must file a single Form 5500 with the Department annually.
- Form PR: The required registration form for PPPs. A person or entity that intends to serve as a PPP for a PEP uses it to report information required under sections 3(43) and 3(44) of the Employee Retirement Income Security Act of 1974 (ERISA) and section 413(e) of the Internal Revenue Code.
- Participant: ERISA section 3(7) defines “participant” as “any employee or former employee of an employer, or any member or former member of an employee organization, who is or may become eligible to receive a benefit of any type from an employee benefit plan.”
- Plan Number (PN): A three-digit number assigned to a plan by the plan sponsor to identify a particular plan. The plan sponsor or administrator reports the PN on the Form 5500, Part II Item 1d and the Form PR, Part III Item 7b.
- Plan year: A 12-month period designated by a retirement plan for calculating vesting and eligibility, among other things. The plan year can match the calendar year or another annual cycle, such as, July 1 to June 30.
- Pooled employer plan (PEP): An individual account defined contribution retirement plan that provides benefits to the employees of at least two employers that do not have a common interest other than adopting the plan and that meets certain other criteria specified in ERISA section 3(43).
- Pooled plan provider (PPP): Described in ERISA section 3(44) to mean a person designated by the terms of the PEP as a named fiduciary under ERISA, the plan administrator, and the person responsible to perform all necessary administrative duties. The PPP must acknowledge in writing its status as named fiduciary under ERISA and must register with the Department using a Form PR before beginning operations as a PPP.
- Schedule MEP: First available with the 2023 form, Schedule MEP is a required Form 5500 attachment for multiple-employer pension plans. It consolidates SECURE Act-related and other MEP reporting into one schedule, including ERISA Section 103(g) participating employer information and aggregate account information. Only PEPs must complete Part III, which reports information about their PPPs’ compliance with the Form PR registration requirements.
- Statistical year: Refers to all Form 5500 employee benefit plan filings with a plan year ending date between January 1 and December 31 of a given year. This bulletin presents statistical year 2023 Form 5500 data for plans with plan years ending between January 1, 2023, and December 31, 2023.
Introduction
Multiple employer plans (MEPs) are retirement savings plans adopted by two or more employers that are unrelated for income tax purposes but share a common business element or belong to the same professional employer organization. The SECURE Act of 2019 created PEPs as a type of MEP. PEPs are individual account defined contribution retirement plans that provide benefits to employees of at least two employers that do not have a common interest other than adopting the plan.
PEPs must be sponsored and administered by a PPP, which assumes most of the administrative and fiduciary responsibilities of sponsoring a retirement plan.(3) Participation in a PEP can reduce these responsibilities for the employer but can also limit their control over plan features and oversight. PEPs may appeal to smaller employers because they can offer diversified investment lineups at lower costs and reduce the administrative burden of sponsoring a retirement plan. Lawmakers and the Department anticipate PEPs will improve retirement savings for workers who previously had no access to an employer-sponsored retirement plan.
Persons or entities intending to serve as a PPP must file a Form PR to register and report certain information about their operations, services and regulatory compliance. The Form PR does not have an annual filing requirement. Instead, specific events trigger the requirement to file.
A PPP must file a Form PR:
- prior to beginning operations,(4)
- when it offers a new PEP,
- when it terminates a PEP,
- after any changes to the registration,
- after it corrects mistakes in prior filings, or
- after the PEP files its final Form 5500 filing and the PPP ceases operations.
Each PEP must file a single Form 5500 annually and include the PEP plan characteristic code(5) on the form. Beginning with the 2023 Form 5500, PEP filers must also identify the plan as a PEP on Schedule MEP.
PEPs must report the following information on Schedule MEP:
- name and EIN of participating employers,
- share of total contributions for each employer,
- aggregate account balances for each participating employer, and
- whether the PPP has complied with the Form PR filing requirements and if so,
- the unique filing identifier for the most recent filing.
The Department released a statistical bulletin on PEPs in 2025 using Form 5500 data from statistical years 2021 and 2022. The introduction of Schedule MEP in 2023 changed the filing requirements for PEPs and led the Department to significantly revise how it identifies PEPs. Because changes in methodology prevent direct comparisons with last year’s data, the Department does not present plan-level trends over time.
New machine-readable participating employer data from Schedule MEP show that some PEPs filed the Form 5500, but reported no participants, assets, or participating employers with account balances. For the purposes of this bulletin, the Department excludes PEPs if all three data elements (participants, assets, and employers with account balances) are absent. As a result, most statistics in this bulletin focus on the remaining subset of PEPs that the Department classified as “active”, based on having reported participants, assets, or participating employers with account balances.
This bulletin primarily uses data from Form PR filings and Form 5500 filings and contains four sections.
Section I presents statistics on Form PR filings from November 25, 2020, through December 31, 2024. It focuses on information collected from the Form PR, including the total number of Form PR submissions since 2020, the filing purpose, and the number of PPPs from year to year.
Section II presents statistics on PEPs based on Form 5500 filings for statistical year 2023. It provides summary tables on participants, assets, contributions, benefits, funding arrangements, investment vehicles, and other characteristics.
Section III analyzes operating PEPs and PPPs, participating employers in PEPs, and the types of services PEPs offer.
Section IV highlights the bulletin’s main findings and notes areas for future analysis.
Section I: Form PR Data
Any person or entity wishing to serve as a PPP must file a Form PR with the U.S. Departments of Labor and Treasury.(6)
Unlike the Form 5500, the Form PR does not require annual filing. Instead, specific events trigger the requirement to file the Form PR. These filing obligations fall into four categories:
- Initial Registration Filings: Provide basic PPP identifying information. PPPs must register at least 30 days before beginning operations. The Form PR requires only one registration for each PPP, no matter how many PEPs it operates. However, the EFAST2 system does not restrict a PPP from filing multiple initial registrations.
Supplemental Filings: Report or update certain information after an initial filing or prior supplemental filing. These filings cover:
- changes to previously reported information,
- a new or terminating PEP,
- other changes in PPP circumstances, and
- removal of criminal information after an acquittal.
Supplemental filings are due within the later of 30 days after the calendar quarter in which specified reportable events occurred or 45 days after the actual event.
- Amended Filings: Correct inadvertent or good-faith errors or omissions in a previously filed Form PR. Amended filings must be submitted as soon as is reasonable after discovering an error or omission in a prior filing.
- Final Filings: Report when an entity has ceased operating all PEPs and terminated operations. PPPs must submit the final filing within the later of 30 days after the calendar quarter in which the PPP filed the final Form 5500 for its last PEP, or 45 days after that filing.
The Form PR is filed when certain events occur rather than annually, so filings are not tied to a specific plan year. For this bulletin, the Department tabulated filings based on their EFAST2 submission date. Filing year 2023 includes all Form PR filings submitted from January 1, 2023, to December 31, 2023.
Number of Filings and Filing Purposes
Figure I.1 shows the total number of Form PR filings the Department received each filing year, as measured by unique filing identifier.(7) There is no limit on the number of Form PR filings a PPP can submit. A PPP should submit only one initial filing and one final filing. However, the number of supplemental or amended filings may vary for different reasons, such as adding or removing PEPs or correcting filer error. Some Form PR filings select more than one filing reason.
In total, there were 933 Form PR filings during 2020-2024.(8) Beginning in 2021, Form PR filings averaged 223 per year. Filing year 2023 saw the highest volume of total filings. The total filings in the most recent filing year, 2024, was close to the average over 2021-2024.
Figure I.1: Form PR Filings by Filing Year, 2020-2024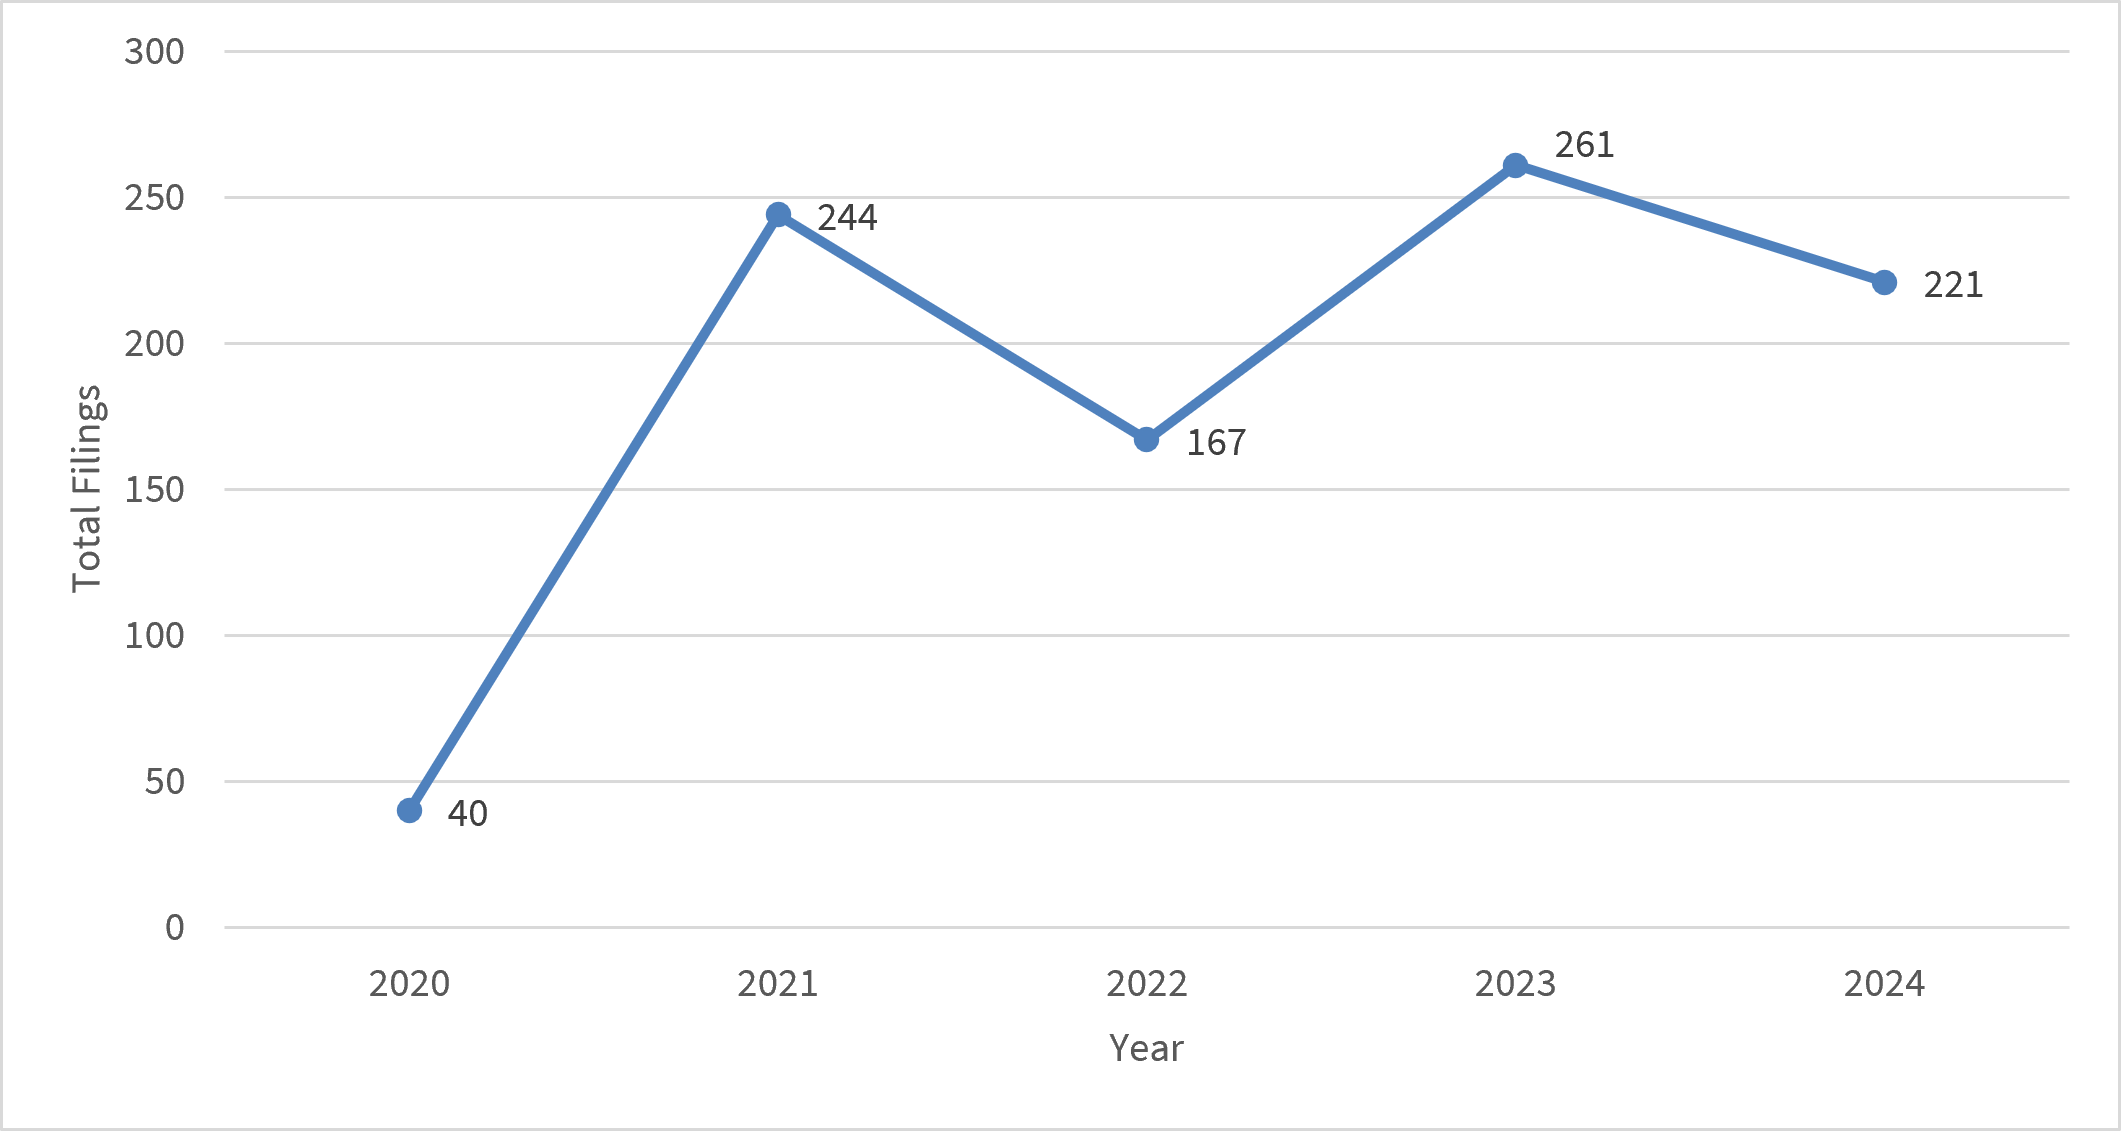
SOURCE: Form PR filings for filing years 2020-2024.
The Department uses distinct EINs to count unique PPPs within the Form PR database. The count does not depend on how many Form PR filings a PPP submits or what type they are. This method differs from Figure I.1, which shows the total number of Form PR filings received by the Department. Table I.1 shows the universe of unique PPPs over the period 2020-2024. Statistics are presented as of December 31 of a given filing year. For example, 2023 statistics are based on totals as of December 31, 2023.
To calculate the total number of unique PPPs for each filing year, the Department uses the prior year’s total as its starting point. It then adds new PPPs and subtracts terminating PPPs. New PPPs are those that filed a Form PR under an EIN that appears for the first time in the Form PR database.(9) Terminating PPPs are those that submitted a final filing during the filing year.
As of December 31, 2024, there were 167 PPPs. This was a 17 percent increase from December 31, 2023. Calendar year 2021 had the highest number of new PPPs, with 60 registering with the Department. Excluding 2021, new PPPs averaged 30 per year.
The Form PR data shows that 13 PPPs ceased operations from 2020 to 2024.(10) Almost half of them terminated in calendar year 2024.
Table I.1: Universe of Unique Pooled Plan Providers (PPPs), 2020-2024
By PPP Status
| Measure | 2020 | 2021 | 2022 | 2023 | 2024 |
| Registered PPPs | 0 | 31 | 88 | 119 | 143 |
| New PPPs | 31 | 60 | 34 | 25 | 30 |
| Terminating PPPs | 0 | 3 | 3 | 1 | 6 |
| Total PPPs | 31 | 88 | 119 | 143 | 167 |
SOURCE: Form PR filings for filing years 2020-2024.
Of the 167 unique PPPs still registered with the Department at the end of 2024, a few appear to share common affiliations, with the same person serving as the compliance official and form signer across multiple PPPs. This suggests that the PPP market may be more consolidated than it appears from counts based solely on unique EINs.
Section II: Form 5500 Data
PEPs must file a single Form 5500 Annual Return/Report each year. Employers participating in a PEP do not file Form 5500 reports individually. Instead, the PPP files the Form 5500 on behalf of the PEP. Beginning in 2023, PEPs must also file a Form 5500 Schedule MEP to identify their plan as a PEP and report information on their participating employers.(11)
For this bulletin’s PEP analysis, the Department identified PEPs as plans that met the following criteria:
- Filed Form 5500 with Schedule MEP
- Identified as a PEP on Schedule MEP by checking Box C in Part I
- Reported a Form PR unique filing identifier in Schedule MEP, Part III 3b, or matched to a Form PR filing based on EIN-PN(12)
This approach differs from the methodology used in the 2025 Pooled Employer Plan Bulletin because Schedule MEP was not available for statistical years 2021 and 2022. For the 2025 Pooled Employer Plan Bulletin, the Department identified PEPs by matching EIN-PNs from 2021 and 2022 Form 5500 filings to Form PR filings.(13)Because the methodology changed, PEP statistics from the two bulletins are not directly comparable.(14)
This section summarizes Form 5500 data that PEPs filed for statistical year 2023. The information presented includes counts of plans and participants for PEPs and their assets, contributions, and benefits.
Number of Plans
The primary purpose of this bulletin is to present statistics on the universe of PEPs and provide key information about these plans, including participants, assets, and participating employers. However, several PEPs omitted this data from their Form 5500 filings. To avoid presenting distorted statistics by including plans that do not report fundamental plan information, the Department distinguishes PEPs by whether this data is included in their 2023 filing.
The Department defines the concept of “active” to mean a PEP that reports plan participants, assets, or participating employers with account balances at the end of the plan year. The Department identified 269 PEPs in statistical year 2023, determining 244 of them to be active based on this definition.
Beginning with Table II.2, the remaining 25 PEPs (i.e., those that filed the Form 5500 and reported no participants, no assets, and no participating employers with account balances) are excluded throughout this report.
The Department believes there are several reasons why PEPs may file the Form 5500 annual report while not qualifying as active (resulting in their exclusion from this bulletin):
- Plans recently launched and submitted an initial filing, but have not yet enrolled any participating employers.
- Plans are winding down operations and submitted a final filing to terminate.
- Plans submitted an initial filing in a prior year, but still have not enrolled any employers, thus their Form 5500 indicates neither an initial nor final filing.
Table II.1 presents the number PEPs by status and filing type. The Department assigns each PEP to one of four filing types using information reported in Form 5500 Part I, Line B:
- Plans that check the box for first return/report are assigned to the Initial Filings category.
- Plans that check the box for final return/report are assigned to the Final Filings category.
- Plans that check both boxes are assigned to the Initial + Final Filings category.
- Plans that check neither box are assigned to the Ongoing Filings category.
In statistical year 2023, 30 percent of all PEPs reported initial and/or final annual report filings. The share was much higher, 88 percent, for PEPs that met the Department’s exclusion criteria. This was an expected result, since beginning and terminating plans are among the likely explanations for reporting no participants, assets, or participating employers.
Table II.1: Distribution of Pooled Employer Plans, 2023
By Status and Filing Type
| Status | Initial Filings | Ongoing Filings | Final Filings | Initial + Final Filings | Total Filings |
| Active | 59 | 185 | 0 | 0 | 244 |
| Excluded | 14 | 3 | 6 | 2 | 25 |
| Total | 73 | 188 | 6 | 2 | 269 |
SOURCE: Form 5500 filings for plan year ending in 2023.
The remaining tables in this bulletin present statistics on the 244 active PEPs in order to better reflect PEPs that are currently operating and providing benefits to participants.
Pooled Employer Plan Participants
The Department used Form 5500 filings to aggregate total and active plan participants(15) at the end of the plan year, as shown in Table II.2.(16) In statistical year 2023, PEPs reported 1.2 million total participants and 1.1 million active participants.
Table II.2: Number of Active Pooled Employer Plans and Participants, 2023
| Number of Plans | Total Participants (thousands) | Active Participants (thousands) |
| 244 | 1,155 | 1,052 |
NOTE: Participants are tabulated as of the end of the plan year.
SOURCE: Form 5500 filings for plan year ending in 2023.
Table II.3 shows the distribution of total participants reported for active PEPs. The number of PEP participants varies widely. In statistical year 2023, the largest active PEP reported 537,703 total participants, accounting for 47 percent of all participants in active PEPs. The smallest active PEP reported just two total participants. Half of active PEPs reported 387 or fewer total participants.
Table II.3 Distribution of Total Participants for Active PEPs, 2023
| ACTIVE PEPs | TOTAL PARTICIPANTS PER POOLED EMPLOYER PLAN | |||
| Minimum | Average | Median | Maximum | |
| 244 | 2 | 4,733 | 387 | 537,703 |
NOTE: Participants are tabulated as of the end of the plan year.
SOURCE: Form 5500 filings for plan year ending in 2023.
Figure II.1 shows the distribution of total participants reported for active PEPs. In statistical year 2023, 78 active PEPs reported 1,000 or more total participants, and 13 of those PEPs reported 10,000 or more total participants. Conversely, nearly a quarter (57) of all active PEPs had fewer than 100 total participants across all participating employers.
Figure II.1: Distribution of Total Participants for Active Pooled Employer Plans, 2023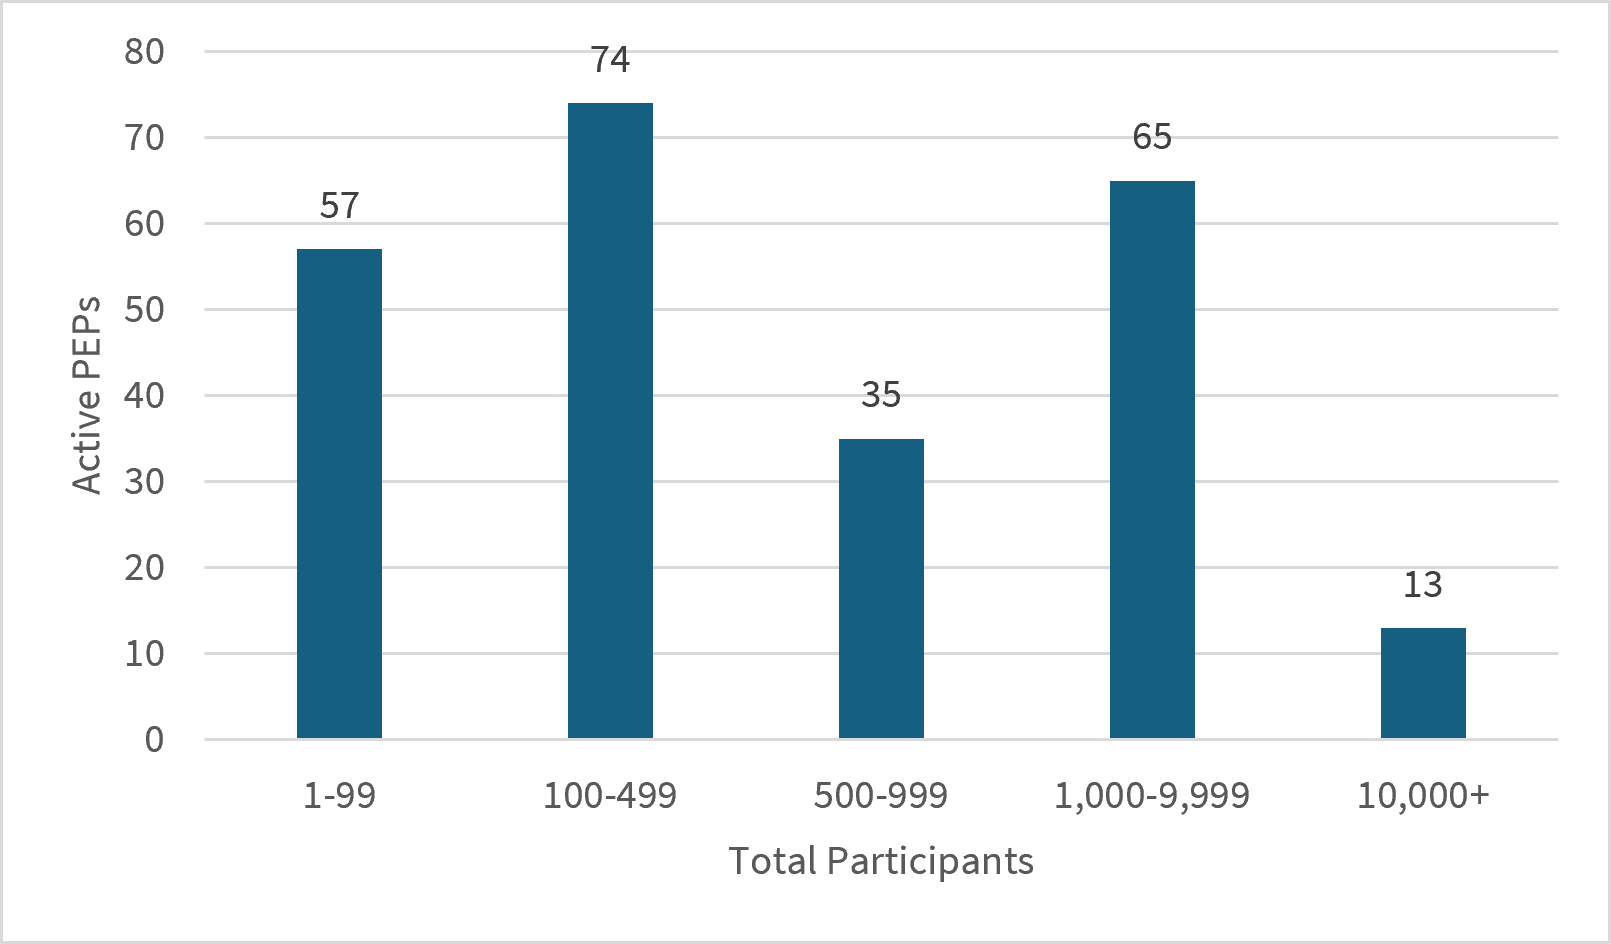
NOTE: Participants are tabulated as of the end of the plan year.
SOURCE: Form 5500 filings for plan year ending in 2023.
Table II.4 provides data on participants and beneficiaries for active PEPs. In statistical year 2023, active participants accounted for 91 percent of total PEP participants. Of the 1.2 million participants reported, 1.1 million were active, 3,000 were retired or separated and receiving benefits, and 100,000 were other retired or separated with a vested right to benefits.
All but one active PEP reported participants with account balances. Among active PEPs, 484,000 participants had account balances, which represented 42 percent of total PEP participants.
Table II.4: Participants and Beneficiaries in Active Pooled Employer Plans, 2023
By Type of Participant
(thousands)
| Type of Participant | 2023 |
| Active Participants | 1,052 |
| Retired or Separated Participants Receiving Benefits | 3 |
| Other Retired or Separated Participants with Vested Right to Benefits | 100 |
| Total Participants | 1,155 |
| Participants with Account Balances | 484 |
| Beneficiaries(17) | */ |
| Total Participants and Beneficiaries | 1,155 |
NOTES: Participants are tabulated as of the end of the plan year.
Some totals do not equal the sum of the components due to rounding.
*/ Fewer than 500 participants.
SOURCE: Form 5500 filings for plan year ending in 2023.
Figure II.2 shows the distribution of active PEPs by the share of total participants that report account balances. The largest number of PEPs reported that 60 to 69 percent of total participants had account balances. At the low end, four active PEPs reported that fewer than 10 percent of participants had account balances. At the high end, 23 active PEPs reported that all participants had account balances.
Figure II.2: Distribution of Participants with Account Balances, 2023
Share of Total Participants Per PEP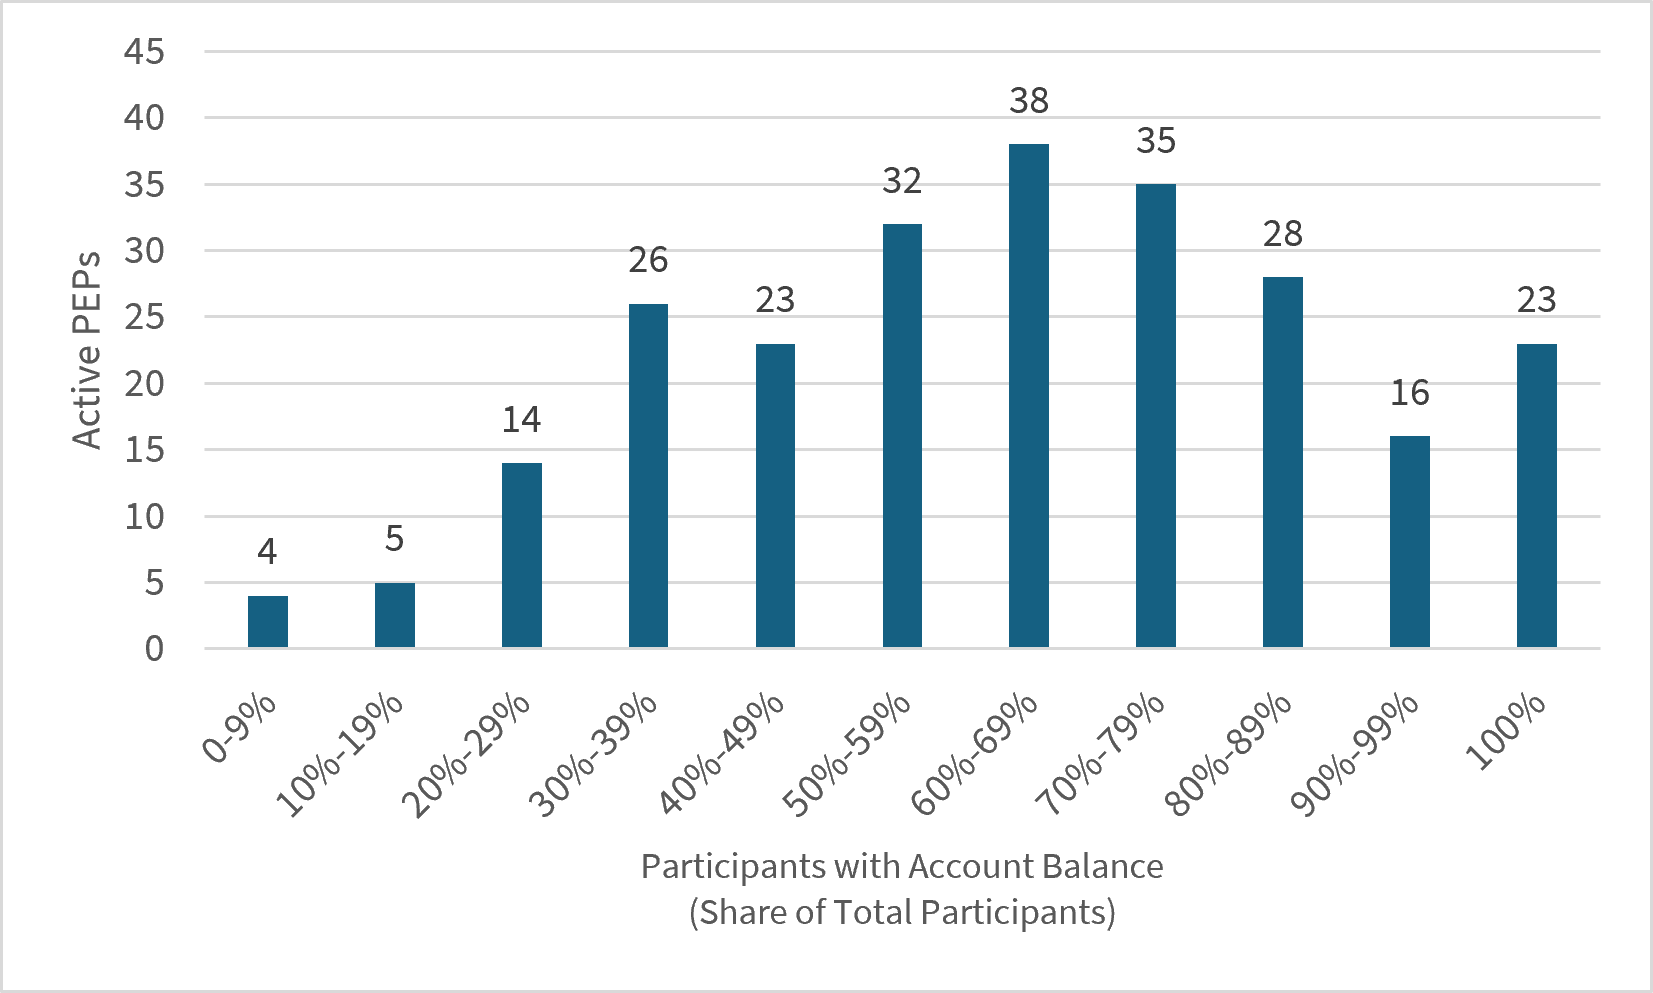
NOTE: Participants are tabulated as of the end of the plan year.
SOURCE: Form 5500 filings for plan year ending in 2023.
Pooled Employer Plan Assets
The Department examined the Form 5500 Schedule H or I for PEP filers to understand the finances of PEPs.(18) Schedules H and I capture financial information for plans, including assets, liabilities, contributions and expenses. PEPs must follow the filing instructions defined for contribution plans, which require that plans with 100 or more beginning-of-year participants with account balances file a Schedule H.(19) PEPs with fewer than 100 beginning-of-year participants with account balances should file a Schedule I because they are not eligible for simplified reporting on the Form 5500-Short Form. Table II.5 shows the total assets, contributions, and benefits of PEPs in statistical year 2023.
Table II.5: Assets, Contributions, and Benefits for Active Pooled Employer Plan, 2023
| Number of Plans | Total Assets (millions)(20) | Total Contributions (millions)(21) | Total Benefits (millions)(22) |
| 244 | $11,755 | $2,500 | $952 |
NOTES: Totals are tabulated as of the end of the plan year.
SOURCE: Form 5500 filings for plan year ending in 2023.
In statistical year 2023, PEPs held about $11.8 billion in total assets and received $2.5 billion in total contributions.
Figure II.3 shows PEP assets are concentrated in the top quintile of the distribution. In 2023, the top 20 percent of PEPs by asset size held 86 percent of all assets. Furthermore, the top 1 percent, consisting of just 2 PEPs, held 24 percent of all PEP assets. This signals that some PEPs in this market have an outsized impact on coverage.
Figure II.3: Distribution of Assets for Active Pooled Employer Plans, 2023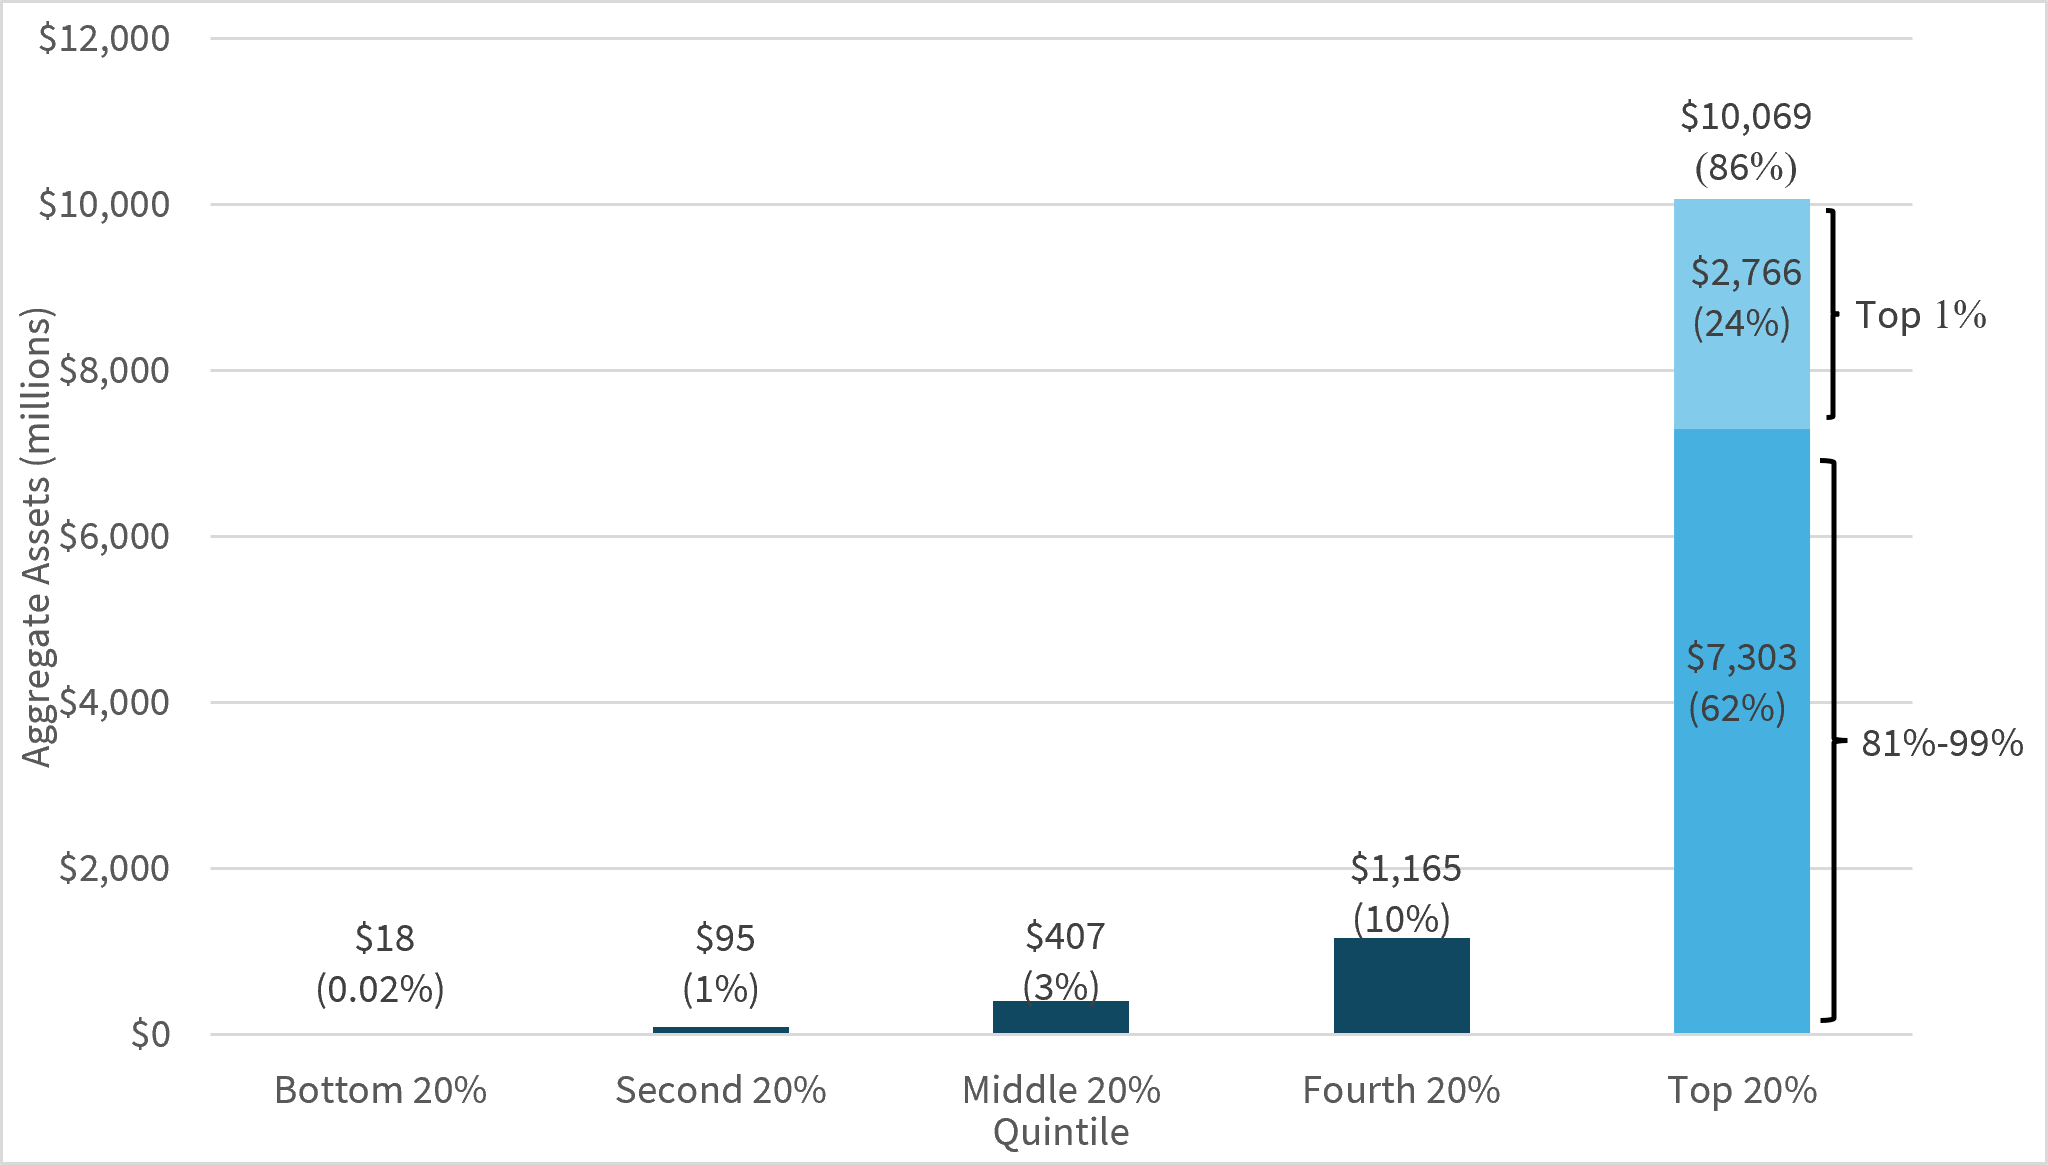
SOURCE: Form 5500 filings for plan year ending in 2023.
PEPs disbursed roughly $1 billion in benefit payments in statistical year 2023. They made these payments either directly to participants and beneficiaries, including direct rollovers, or indirectly through insurance carriers.
Overall, PEPs disbursed $1.5 billion less than they received in contributions during statistical year 2023.
Like other pension plans, PEPs use the Form 5500 financial reporting schedules to report the asset categories for their financial holdings and investments. Table II.6 is calculated by aggregating similar asset categories from Schedules H or I.
However, the table presents the aggregated asset categories in a similar format to Schedule I of the Form 5500. All asset categories that appear on the more detailed Schedule H but not the Schedule I are grouped under the “Other Investments” category, which includes receivables, interest and non-interest-bearing cash, registered investment companies, common collective trusts, pooled separate accounts, and other general or unspecified assets.
In the statistical year 2023 data, PEP filings did not report any assets in the “Partnership/Joint Venture Interests,” “Employer Real Property,” or “Real Estate (Other Than Employer Real Property)” categories. The “Other Investments” category held the largest share of PEP assets.
Table II.6: Balance Sheet of Active Pooled Employer Plans, 2023
By Type of Asset or Liability
(millions)
| Type of Asset or Liability | 2023 |
| Partnership/Joint Venture Interests | - |
| Employer Real Property | - |
| Real Estate (Other Than Employer Real Property) | - |
| Employer Securities | $24 |
| Participant Loans | $136 |
| Loans (Other Than to Participants) | $4 |
| Other Investments | $11,591 |
| Total Assets | $11,755 |
| Total Liabilities | $7 |
| Net Assets | $11,748 |
NOTES: Assets and liabilities are tabulated as of the end of the plan year.
Some totals do not equal the sum of the components due to rounding
- Missing or zero.
SOURCE: Form 5500 filings for plan year ending in 2023.
While the categories in Table II.6 support consistent asset reporting for PEPs of all sizes by mirroring the Schedule I reporting categories, the Schedule H provides a more detailed breakout of the assets shown in the “Other Investments” category. In 2023, PEPs that filed a Schedule H held 91 percent of their assets in common collective trusts, pooled separate accounts, and registered investment companies (see Appendix Table B.1).
Like Table II.6 above, Table II.7 presents PEP income and expenses reported on Schedule H and Schedule I based on Form 5500 Schedule I reporting categories. The table groups all income and expense items that appear on the more detailed Schedule H but not the Schedule I under the “All Other Income” or “Other or Unspecified Expenses” categories. These items include interest earnings, dividends, rents, and several line items reporting realized or unrealized gains/losses on investments.
In statistical year 2023, “Participant Contributions” accounted for the largest share of PEP income at 38 percent. “All Other Income,” which largely comprised of plan earnings on investments, accounted for the second-largest share at 34 percent. This result is consistent with strong stock market performance in 2023.(23)
Most PEP expenses were due to benefits paid out to participants and beneficiaries. “Administrative Expenses” averaged about 5 percent of total expenses for statistical year 2023.
Table II.7: Income Statement of Active Pooled Employer Plans, 2023
(millions)
| INCOME AND EXPENSES | 2023 |
| Income | |
| Employer Contributions | $580 |
| Participant Contributions | $1,430 |
| Contribution from Others (including Rollovers) | $490 |
| Noncash Contributions | **/ |
| All Other Income | $1,309 |
| Total Income | $3,809 |
| Expenses | |
| Total Benefit Payments(24) | $952 |
| Certain Deemed and/or Corrective Distributions | $9 |
| Administrative Expenses(25) | $48 |
| Other or Unspecified Expenses | $3 |
| Total Expenses | $1,011 |
| Net Income | $2,798 |
NOTES: Some totals do not equal the sum of the components due to rounding.
**/ Less than $500,000
SOURCE: Form 5500 filings for plan year ending 2023.
PEPs reported $48 million in administrative expenses in statistical year 2023. Figure II.4 presents per participant administrative expenses by total participant size for active PEPs reporting administrative expenses. Average administrative expenses per participant decrease as total PEP participants increase. Administrative expenses averaged $233 per participant for PEPs with fewer than 100 participants compared to $52 per participant for PEPs with more than 10,000 participants. Variance in administrative expenses per participant also decreases as total participants increase.
Figure II.4: Distribution of Administrative Expenses per Participant, 2023
Active PEPs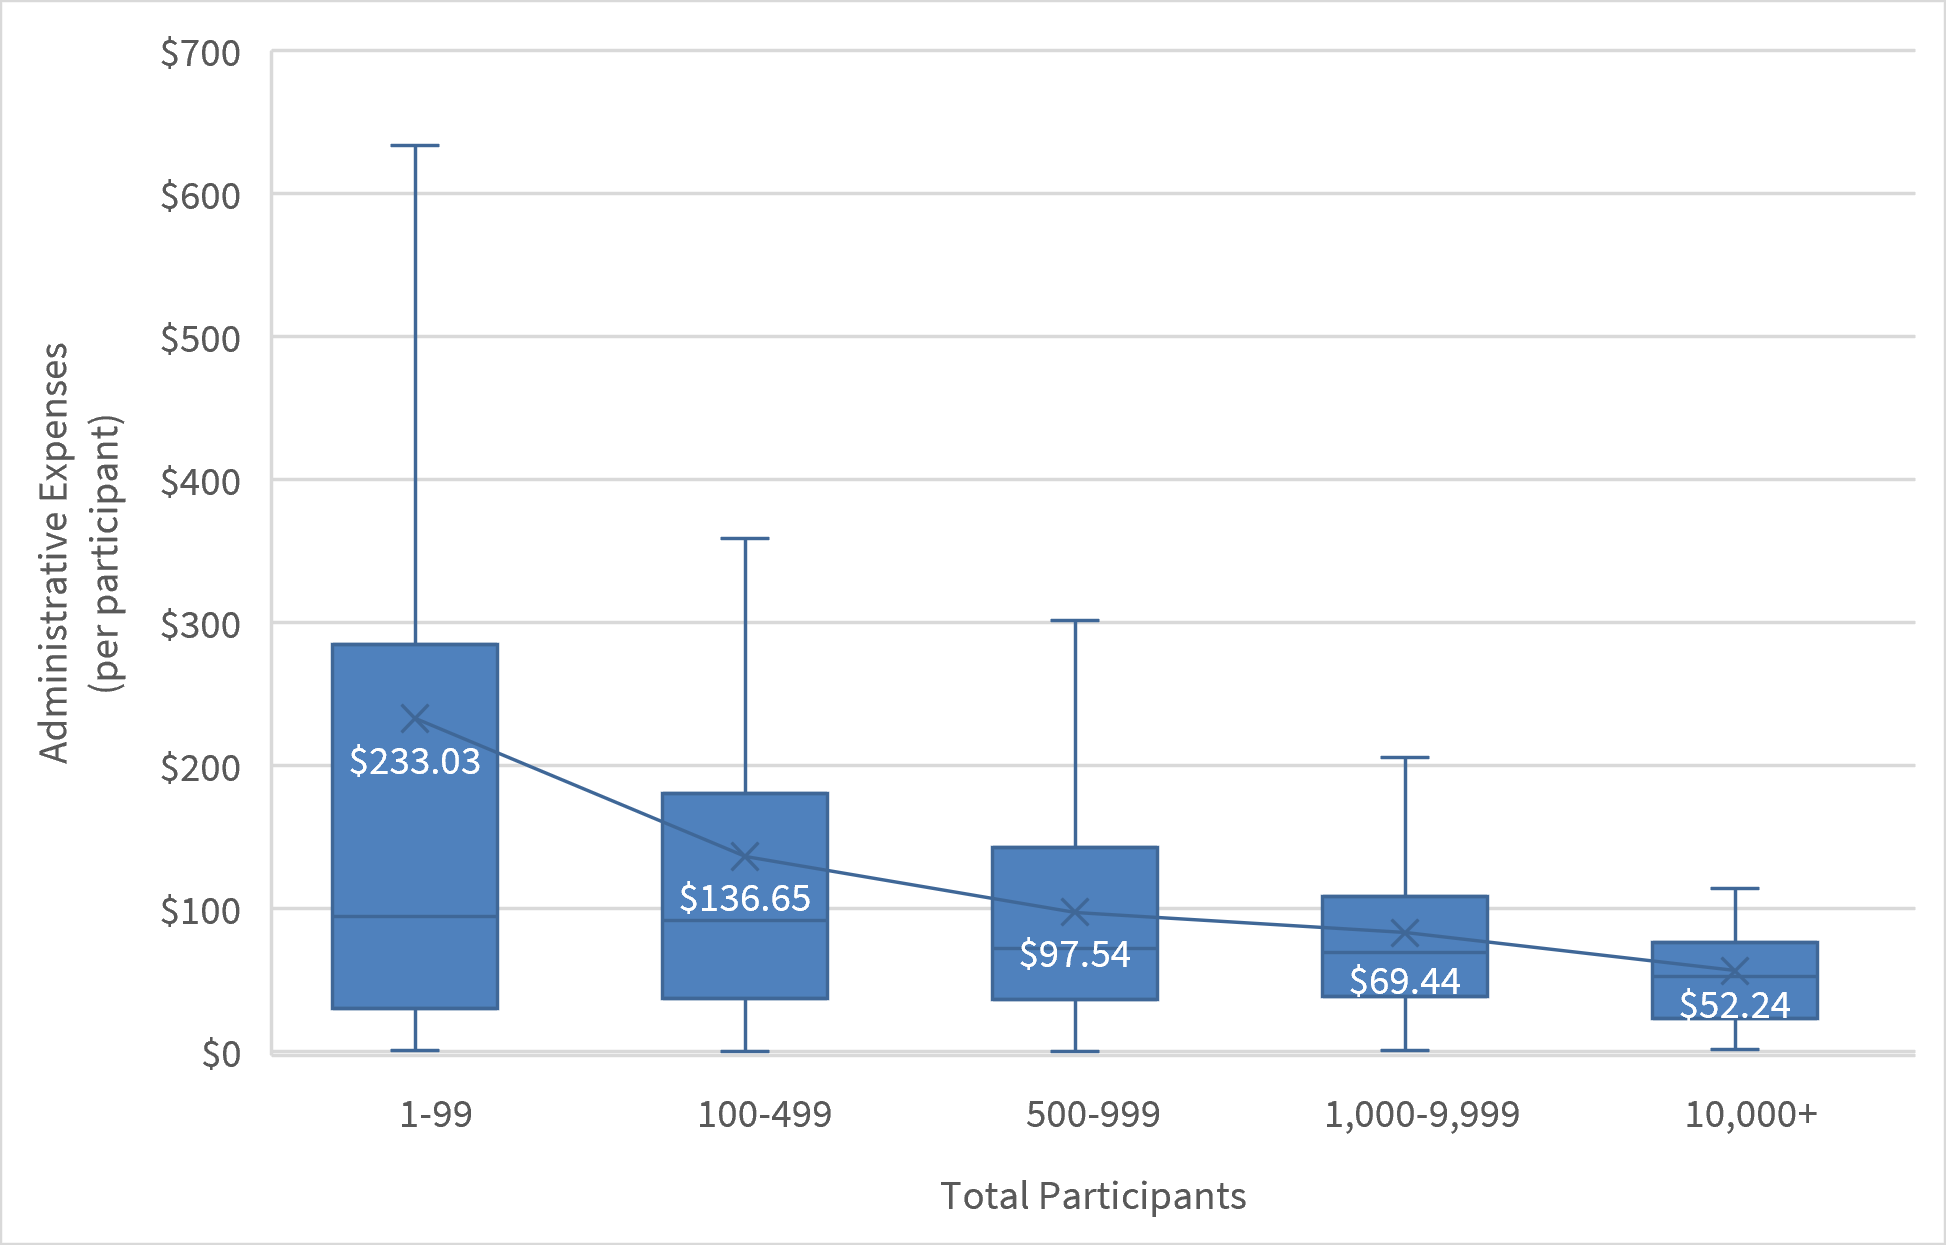
NOTES: Participants measured by Total Participants reported at end of year on Form 5500 Line 6f.
The figure excludes 15 active PEPs that reported no administrative expenses (either $0 or not reported).
SOURCE: Form 5500 filings for plan year ending 2023.
Form 5500 pension filers must report the plan’s funding method and benefit payouts on their returns.(26) Filers can report more than one arrangement for their funding and benefit payments. The Department grouped the arrangement options into “Insurance,” “Section 412(i) Insurance,” “Trust,” “Trust and Insurance,” and “General Assets of the Sponsor.”
Table II.8 presents the prevalence of these different funding arrangements for investment of assets and payment of benefits. It shows both the number of PEPs that reported each arrangement and the assets held by those PEPs. In statistical year 2023, more PEPs used trusts to fund investments and pay benefits than any other funding arrangement. The “Trust and Insurance” method reported the largest share of PEP assets compared to other categories.
Table II.8: Funding Arrangements for Active Pooled Employer Plans, 2023
By Method of Funding
| Funding Arrangement for Investment of Assets | ||
| Number of PEPs | Assets by Reporting Category (millions) | |
| Insurance | 2 | $60 |
| Section 412(i) Ins. | 0 | - |
| Trust | 158 | $3,897 |
| Trust and Insurance | 84 | $7,797 |
| General Assets of the Sponsor | 0 | - |
| Total(27) | 244 | $11,755 |
| Funding Arrangement for Payment of Benefits | ||
| Number of PEPs | Assets by Reporting Category (millions) | |
| Insurance | 2 | $67 |
| Section 412(i) Ins. | 1 | $1 |
| Trust | 164 | $4,145 |
| Trust and Insurance | 77 | $7,542 |
| General Assets of the Sponsor | 0 | - |
| Total | 244 | $11,755 |
NOTES: Assets are tabulated as of the end of the plan year.
Some totals do not equal the sum of the components due to rounding.
- Missing or zero.
SOURCE: Form 5500 filings for plan year ending in 2023.
Section III: Hybrid Analysis
Operating PEPs and PPPs
PPPs file the Form PR to register with the Department and state their intent to operate a PEP.(28) Once a PPP establishes a PEP, it must file the Form 5500 annually to report information on each PEP’s assets and participants.
For the tables in this section, PPPs are defined using the unique EIN reported on the Form PR. PEPs are identified by their Form 5500 filings and mapped to their sponsoring PPP using the EIN.
Table III.1 compares “operating PPPs” (defined as PPPs that filed Form 5500 for an active PEP within the statistical year and mapped to a Form PR filing by their sponsoring PPP using the EIN) versus “total PPPs” (defined as the total number(29) of PPPs registered with the Department via Form PR as of December 31, 2023). As Table III.1 is populated using both Form PR and Form 5500 data, comparison is only possible for 2023.(30) Note that filing year and statistical year is not a one-to-one comparison.(31)
Table III.1 shows that about half of all PPPs operated an active PEP with participating employers and enrolled participants in 2023.
Table III.1: Comparison of Operating Pooled Plan Providers vs. Total Pooled Plan Providers, 2023
| OPERATING PPPs | TOTAL PPPs | PERCENT OF PPPs OPERATING |
| 71 | 143 | 50% |
SOURCE: Form PR filings (2020-2023) and Form 5500 filings (plan year ending in 2023).
Table III.2 shows the distribution of active PEPs per operating PPP for statistical year 2023 based on Form 5500 filings. While there is no limit on the number of PEPs a PPP can operate, Table III.2 shows that the median PPP operated a single PEP. However, some larger PPPs operated multiple PEPs, including a PPP that operated 26 unique PEPs in statistical year 2023.
Table III.2: Distribution of Active Pooled Employer Plans per Operating Pooled Plan Provider, 2023
| OPERATING PPPs | ACTIVE PEPs PER POOLED PLAN PROVIDER | |||
| Minimum | Average | Median | Maximum | |
| 71 | 1 | 3 | 1 | 26 |
SOURCE: Form 5500 filings for plan year ending in 2023.
Figure III.1 is a histogram of active PEPs per operating PPP for statistical year 2023 based on Form 5500 filings. Each histogram bin shows the number of PPPs operating PEPs within the given range. For example, a PPP operating seven PEPs would be included in the 7-11 bin.
Figure III.1 shows that the distribution of active PEPs per operating PPP is asymmetrical.(32) Over two-thirds of PPPs (68 percent) operated a single PEP. Only 11 PPPs (15 percent) operated more than 6 PEPs. The largest PPP operated 26 PEPs.
Figure III.1: Active Pooled Employer Plans per Operating Pooled Plan Provider, 2023
SOURCE: Form 5500 filings for plan year ending 2023.
PEP Participating Employers
Beginning in 2023, PEPs must include Schedule MEP with their Form 5500 filing. In Schedule MEP Part II, PPPs must report the following information for each participating employer within a PEP:
- Name of participating employer
- Participating employer’s EIN
- Participating employer’s share of total PEP contributions for plan year
- Aggregate account balances in the PEP attributable to the participating employer
Table III.3 shows the distribution of participating employers per PEP for statistical year 2023. The number of employers varied substantially, especially when comparing the largest PEP with all others. Half of PEPs had 7 or fewer participating employers, but the largest PEP had 33,773 participating employers. The second largest PEP had 604 employers.
Table III.3: Distribution of Participating Employers per Pooled Employer Plan, 2023
| TOTAL PEPs w/ PARTICIPATING EMPLOYERS(33) | PARTICIPATING EMPLOYERS PER PEP | |||
| Minimum | Average | Median | Maximum | |
| 239 | 1 | 165 | 7 | 33,773 |
SOURCE: Form 5500 filings for plan year ending 2023.
Figure III.2 is a histogram of participating employers per PEP for statistical year 2023. Each histogram bin shows how many PEPs fall within a given range of total participating employers. For example, a PEP with seven participating employers falls in the 6-10 bin (see Appendix A, “Participating Employers,” for more information about employer counting methodology).
Figure III.2 shows an asymmetrical distribution of participating employers per PEP.(34) Of the 239 PEPs that included participating employer information, 61 percent had 10 or fewer participating employers. Only 10 PEPs had more than 100 participating employers and only three PEPs had more than 500.
Figure III.2: Participating Employers per Active Pooled Employer Plan, 2023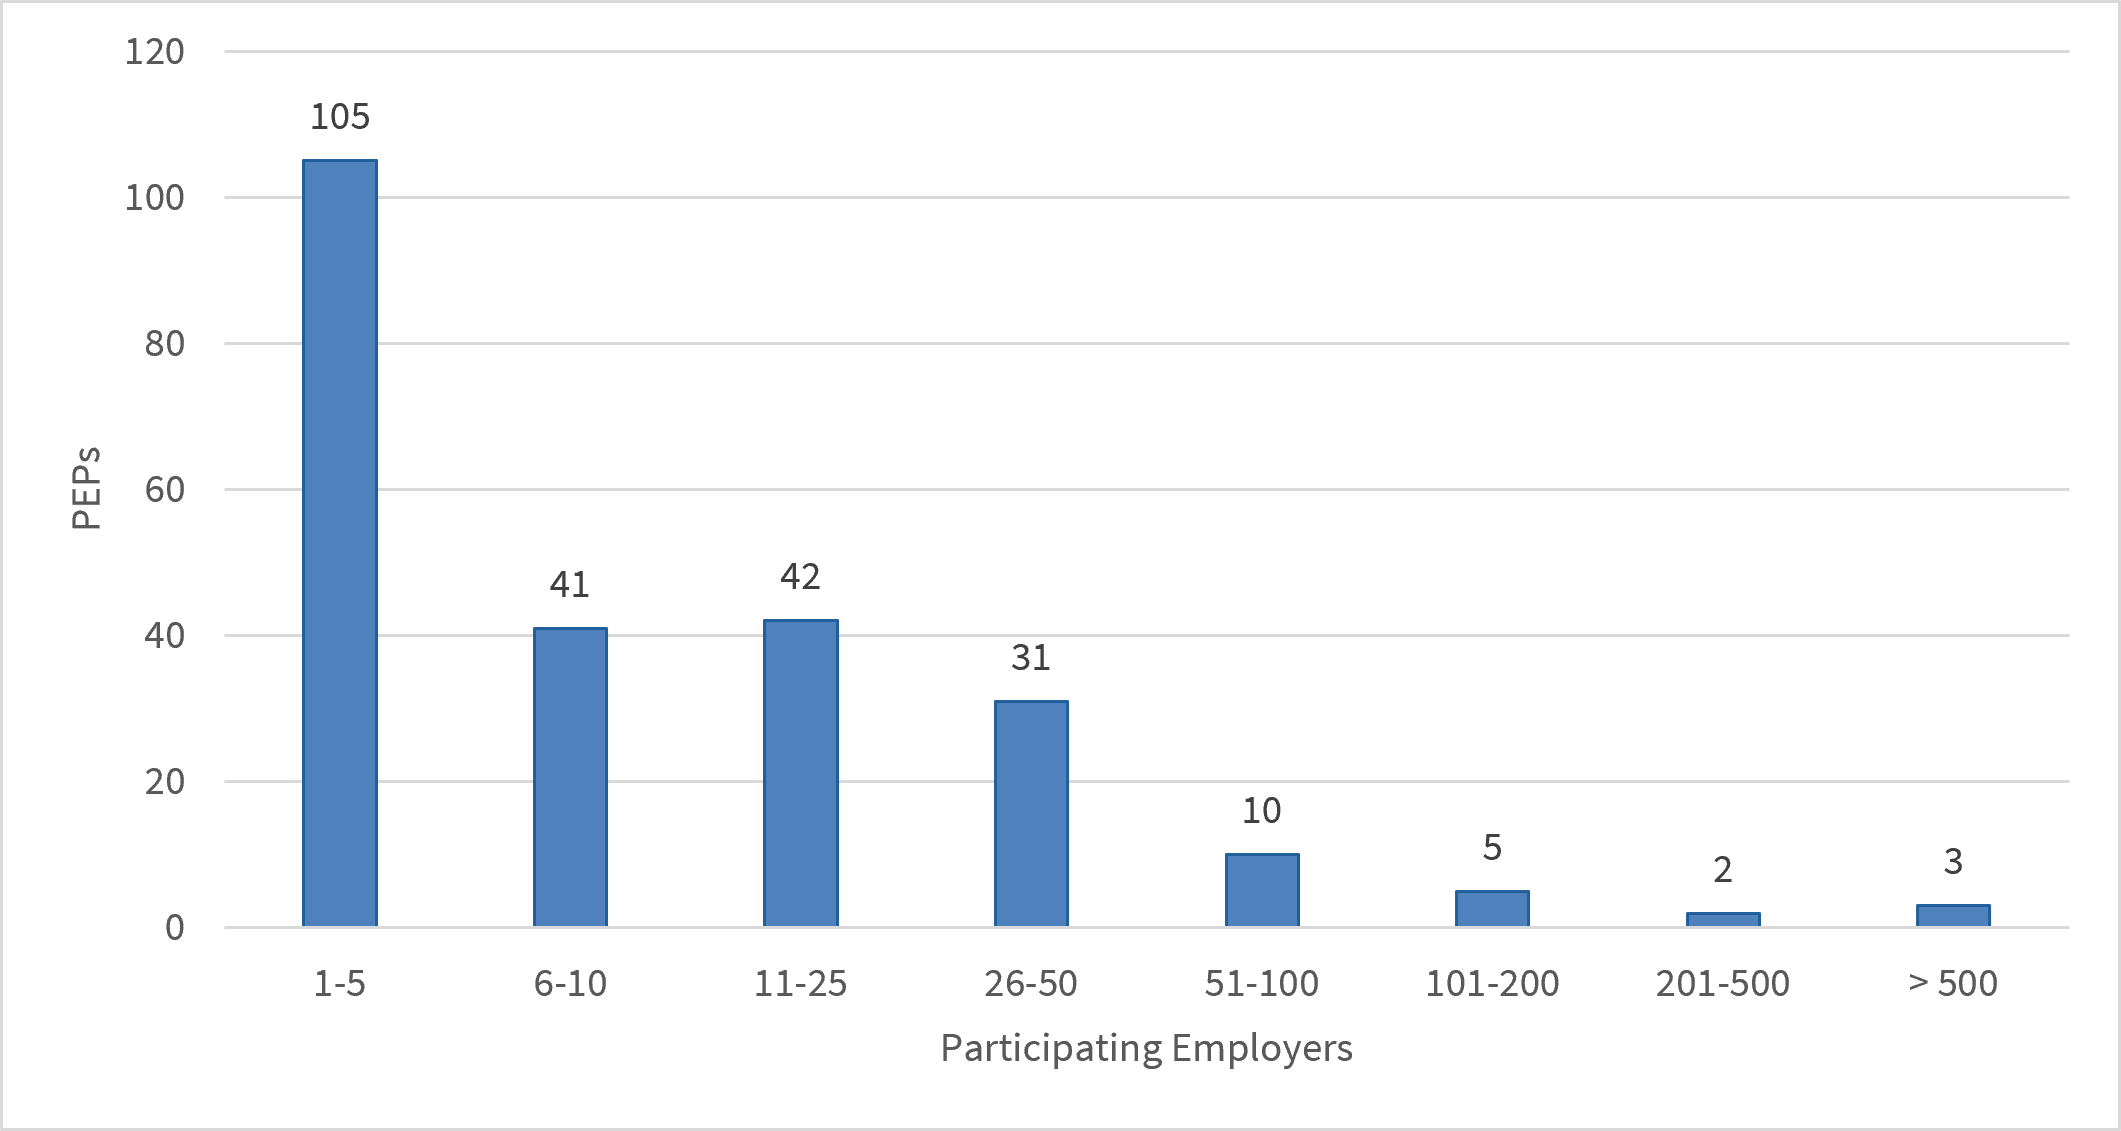
NOTE: This figure excludes five PEPs that reported participants and assets but did not report any participating
employers on their Schedules MEP or via attachment.
SOURCE: Form 5500 filings for plan year ending 2023.
Figure III.3 shows the distribution of employers participating in active PEPs by employee size, using employer size categories from the Bureau of Labor Statistics.(35) In 2023, 96.6 percent of employers participating in PEPs had under 100 employees, including about 40 percent with 1 to 4 employees.(36) Slightly more than half (52.6 percent) of participating employers had between 5 and 49 employees. Only 0.1 percent of participating employers had over 1,000 employees.
Figure III.3: Percent Distribution of Employers Participating in Active PEPs, 2023
By Employee Size Class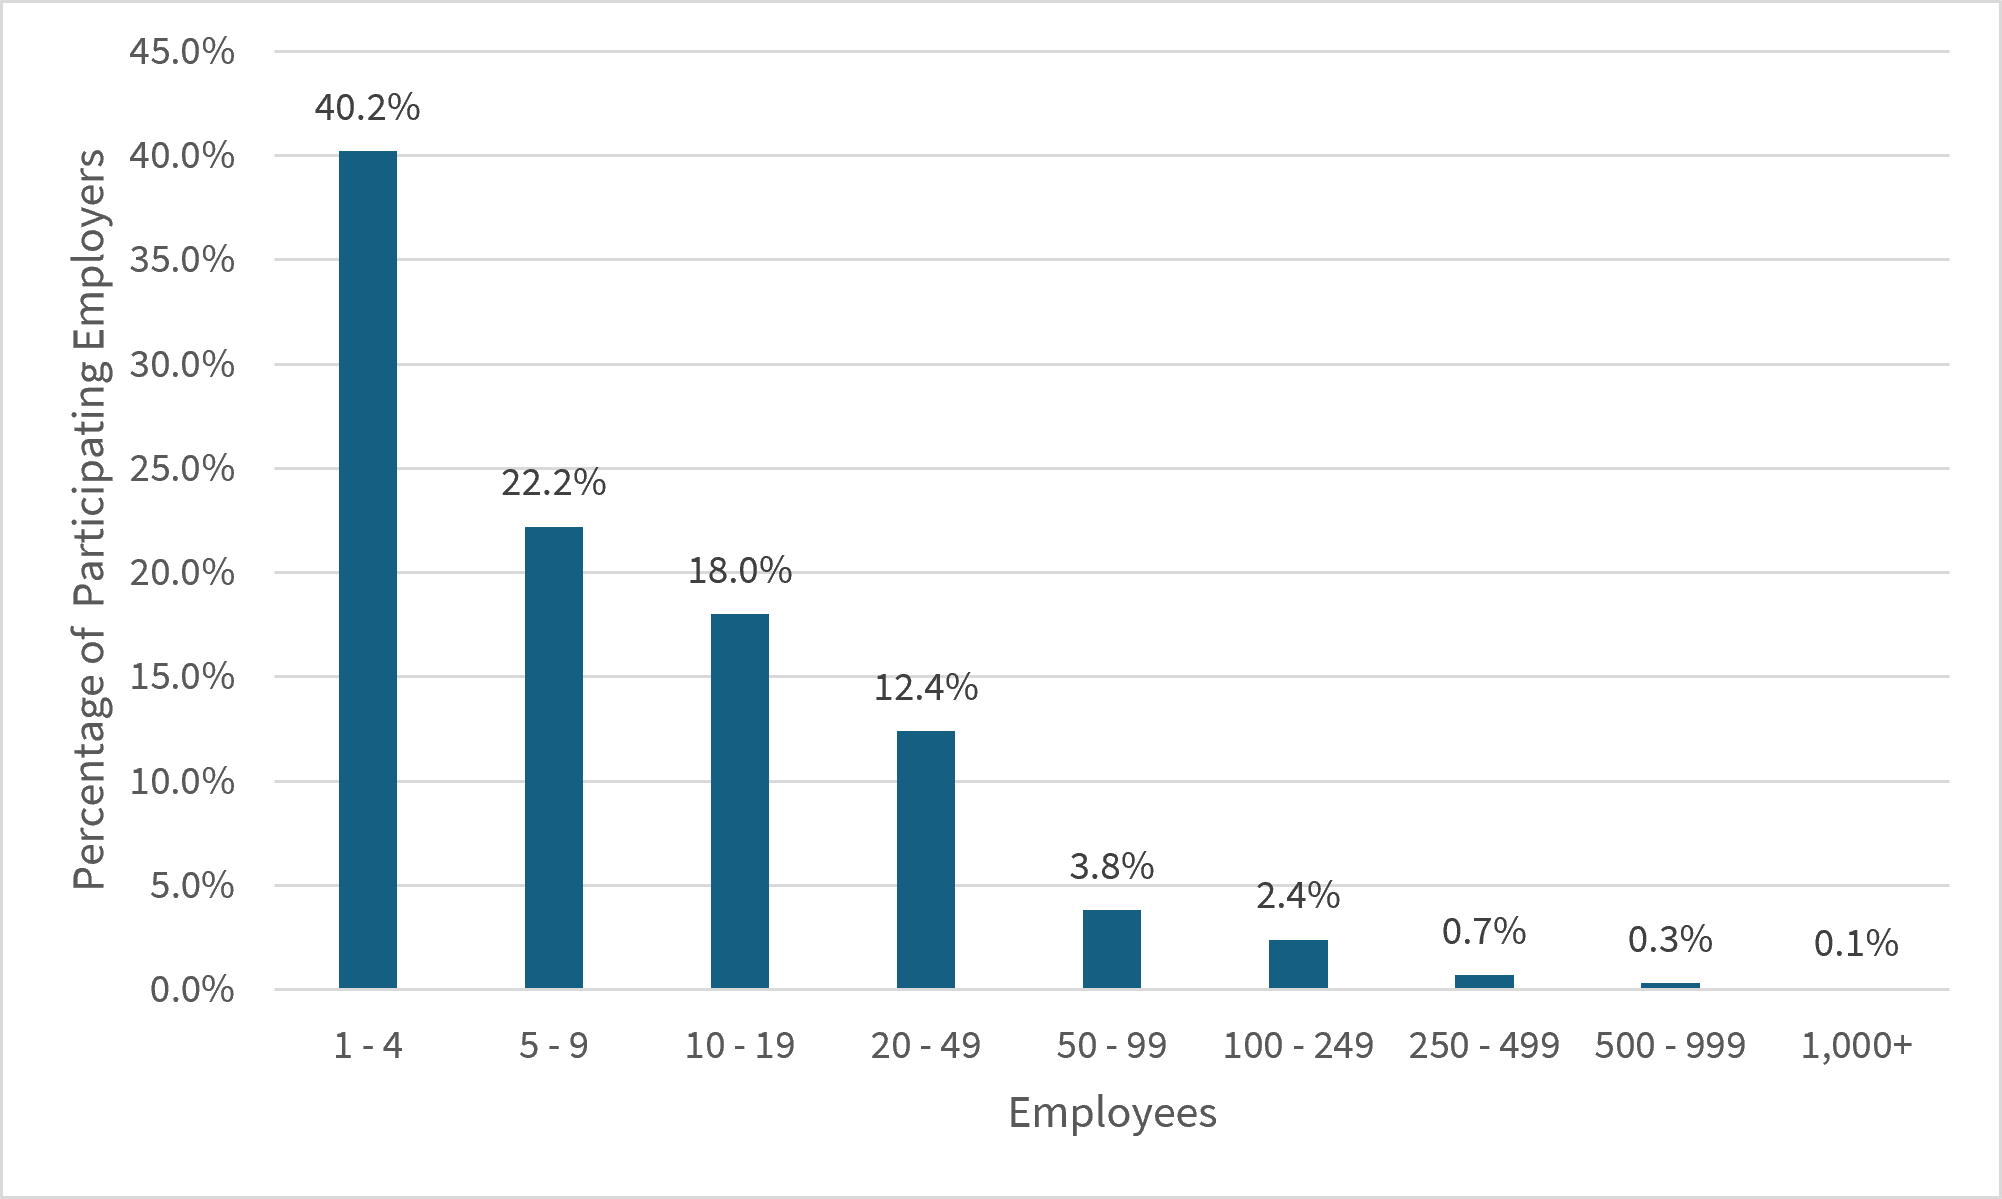
NOTE: This figure excludes 4,797 firms that did not match BLS QCEW business employment records.
SOURCE: Form 5500 filings for plan year ending 2023 and BLS BDM program research data tabulation.
Table III.4 shows the distribution of aggregate account balances(37) per participating employer for statistical year 2023. Half of participating employers had aggregate account balances of $6,000 or less, including one-fifth with an aggregate account balance of $0.(38) The largest participating employer reported an aggregate account balance of $458.6 million.
Table III.4: Distribution of Aggregate Account Balance per Participating Employer, 2023
| UNIQUE PARTICIPATING EMPLOYERS(39) | AGGREGATE ACCOUNT BALANCE (Thousands) | |||
| Minimum | Average | Median | Maximum | |
| 39,446 | $0 | $292 | $6 | $458,577 |
SOURCE: Form 5500 filings for plan year ending 2023.
Figure III.4 is a histogram of aggregate account balances per participating employer for statistical year 2023. Each histogram bin shows the number of participating employers whose aggregate account balance across all PEPs falls within the given range. For example, an employer participating in two PEPs with a combined aggregate account balance of $200,000 falls in the 100K-500K bin.
Figure III.4 shows that the distribution of aggregate account balances per participating employers in statistical year 2023 is also asymmetrical.(40) More than three-fourths of participating employers (78 percent) had aggregate account balances of $50,000 or less, including 22 percent with an aggregate account balance of $0. Conversely, 4 percent of PEP participating employers had aggregate account balances of more than $1 million. Just 11 of the 39,446 unique participating employers had an aggregate account balance over $100 million.
Figure III.4: Aggregate Account Balance per Participating Employer, 2023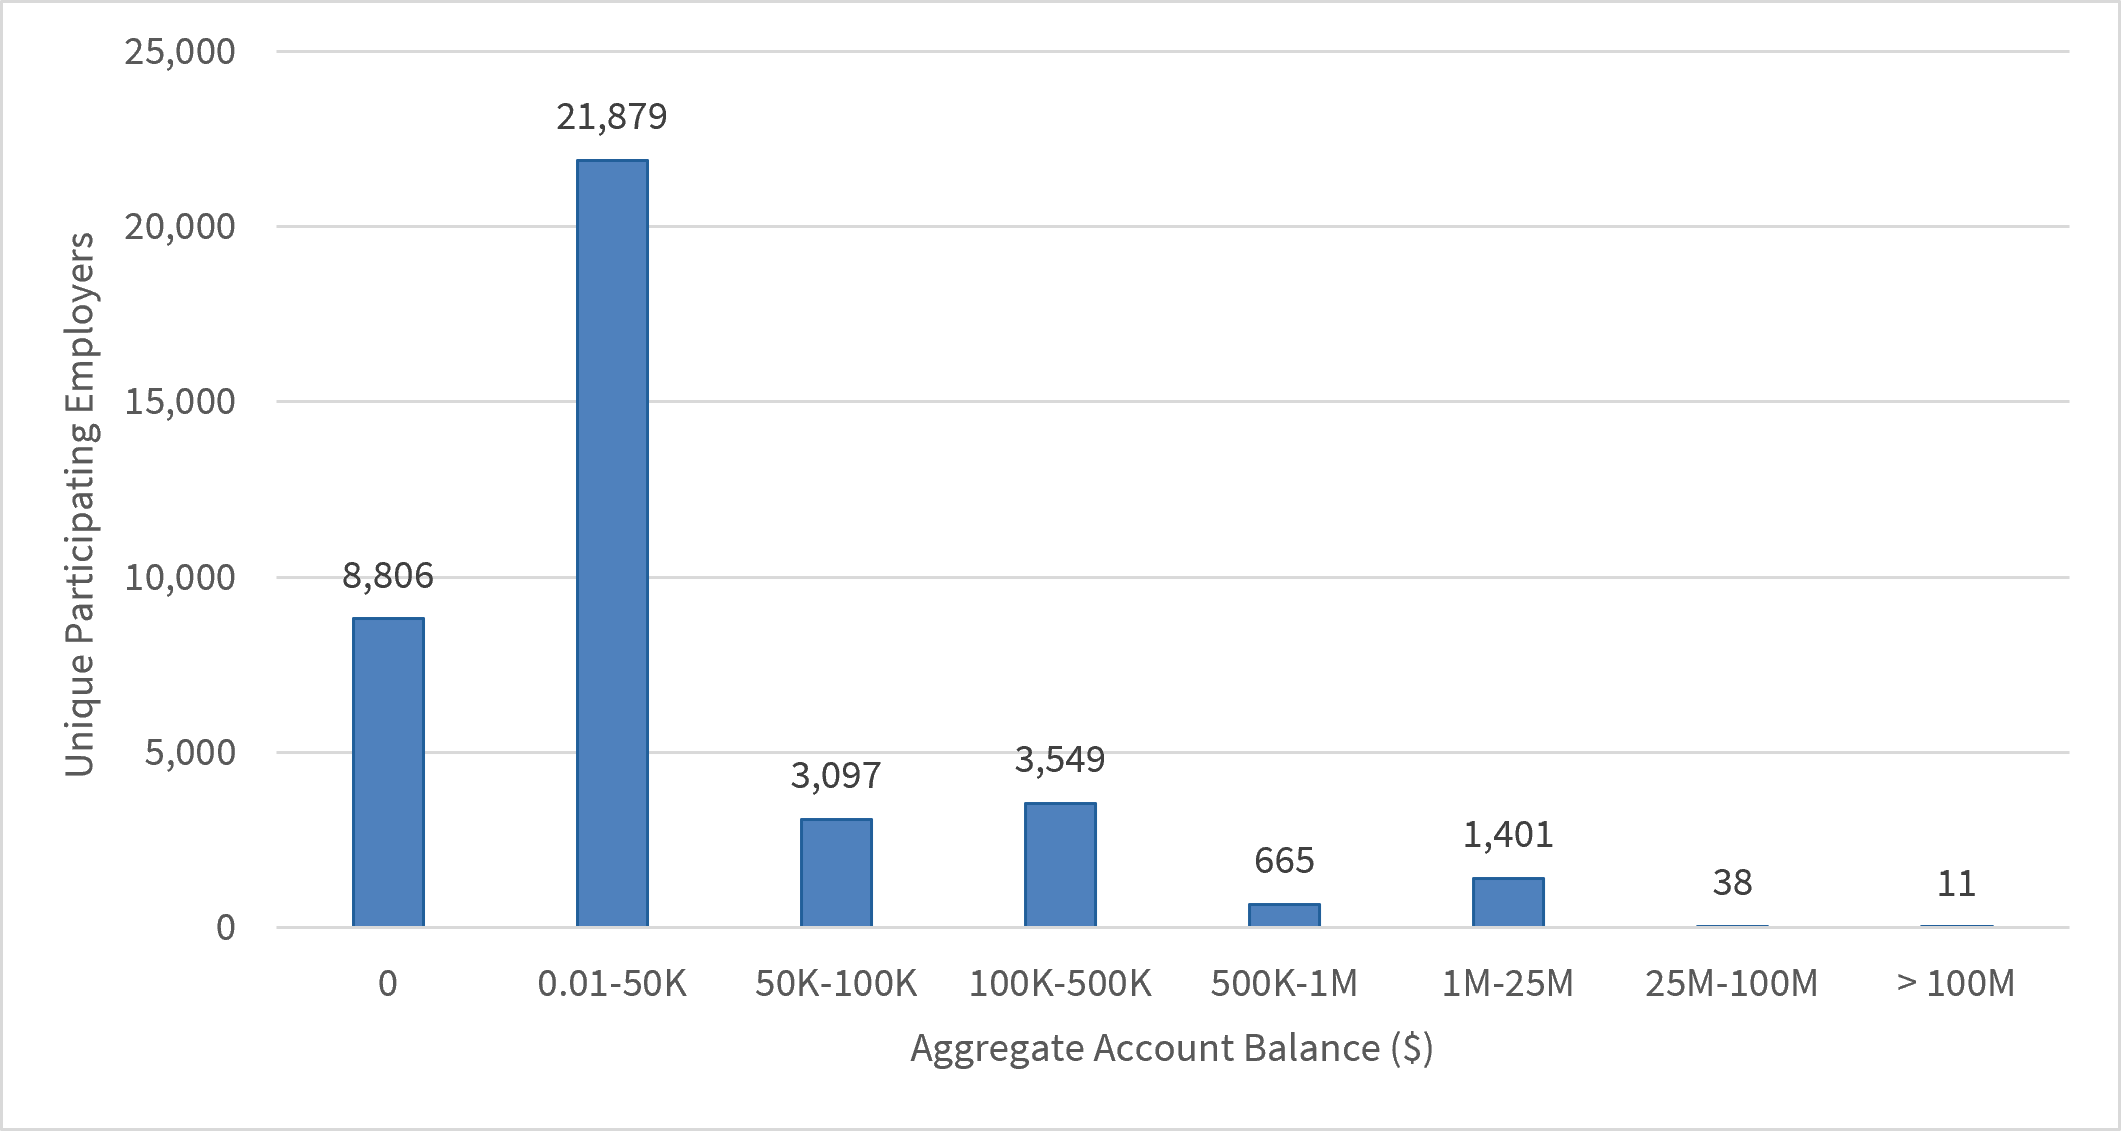
SOURCE: Form 5500 filings for plan year ending 2023.
Services Offered by PEPs and PPPs
To better understand the types of services offered by PEPs, the Department examined the Form 5500 Schedule C data on service providers for PEP filings. The Form 5500 Schedule C includes information on the types of services plans receive, the providers performing those services, and the compensation plans paid for those services. Schedule C data offers insight into the services that PEPs offer, but it may not capture all service providers for a few possible reasons:
- Only plans with 100 or more participants with account balances(41) on the first day of the plan year must report on service providers through the Schedule C,(42)
- Only service provider compensation that is at least $5,000 (whether direct or indirect) is reported on the Schedule C, and
- Schedule C does not require PPPs to report compensation paid directly to them by participating employers.
While PEPs with fewer than 100 participants with account balances at the beginning of the year are not required to file a Schedule C, several did. Table III.5 presents both the total PEPs that included a Schedule C in their reporting and the subset of large plans required to file the Schedule C.
Table III.5: Active Pooled Employer Plans Filing Schedule C, 2023
| PEPs FILING SCHED C | TOTAL PEPs(43) | PERCENT OF PEPs FILING SCHED C |
| All Plans | ||
| 133 | 244 | 55% |
| Large Plans (100 or More Beginning-of-Year Participants with Account Balances) | ||
| 99 | 110 | 90% |
SOURCE: Form 5500 filings for plan year ending in 2023.
Among PEPs that filed a Form 5500 for statistical year 2023, only 50 percent reported service provider information on Schedule C. Of PEPs meeting the plan size filing requirement, 76 percent submitted a Schedule C with their Form 5500 filing.
When completing the Schedule C, plans choose from 31 service codes that describe the services provided and 24 codes that describe the type of compensation received. Filing instructions direct plans to enter all applicable codes. To simplify the service and fee categories for this report, the Department grouped service codes(44) into 29 unique categories for Table III.6. The table presents the most common services provided and compensation arrangements for PEPs that filed a Form 5500 Schedule C in statistical year 2023.
The top services reported by PEPs that met the plan size filing requirement were investment management and advisory services, plan/contract administrator, participant loan processing, and recordkeeping. Some PPPs reported the services they received compensation for on the Schedule C and listed themselves as the person or entity receiving compensation. Other PPPs did not report themselves on Schedule C at all, even for services they must provide by law, such as named fiduciary.
In 2023, only 36 percent of PEPs with 100 or more participants with account balances at the beginning of the year reported using a service provider who served as a named fiduciary. In most instances, the PPP reported itself on Schedule C as the provider of the named fiduciary services. Since PPPs must serve as a named fiduciary, the 64 percent of PEP filings that did not report the PPP in that role likely fell into one of four categories:
- The PPP received compensation directly from participating employers,
- The PPP received less than $5,000 in compensation for that service,
- Compensation may have been reported in a way that did not separately identify named fiduciary services, or
- The PPP did not report all itemized services on the Schedule C for which they received $5,000 or more in compensation.
Table III.6: Share of Services and Compensation Reported by Large Pooled Employer Plans, 2023
By Type of Service and/or Compensation
| Service Code | Pct of PEPs Reporting |
| Services Provided | |
| Accounting | 15% |
| Actuarial | 0% |
| Claims Processing | 29% |
| Consulting | 34% |
| Copying and Duplicating | 2% |
| Custodial | 17% |
| Employee | 0% |
| Foreign Entity | 9% |
| Insurance | 3% |
| Investment Mgmt and Advisory | 78% |
| Legal | 1% |
| Named Fiduciary | 36% |
| Other Services | 19% |
| Participant Communication | 42% |
| Participant Loan Processing | 61% |
| Plan/Contract Administrator | 64% |
| Real Estate Brokerage | 0% |
| Recordkeeping | 54% |
| Securities Brokerage | 5% |
| Trustee | 26% |
| Valuation | 9% |
| Compensation Received | |
| Consulting Fees | 4% |
| Direct Payment from Plan | 43% |
| Indirect – Commissions | 13% |
| Indirect – Fees | 44% |
| Insurance Fees | 8% |
| Inv. Mgmt. Fees | 55% |
| Other Fees or Revenue | 48% |
| Recordkeeping Fees | 72% |
NOTE: Presents statistics on services and compensation only for PEPs large enough to require a Schedule C filing. It excludes
reported service provider information for “voluntary” Schedule C filers (35 small PEPs in 2023).
SOURCE: Form 5500 Schedule C filings, plan year ending in 2023.
Although less detailed than Form 5500 reporting, the Form PR asks PPPs to report on whether they or their affiliates offer any of six categories of products or services related to administration and investment oversight.
Table III.7, using data from the Form PR, shows that 76 percent of PPPs reported offering at least one listed service or product category. Plan administration was the most commonly reported service at 64 percent of PPPs.
Table III.7: Products or Services Reported by Pooled Plan Providers, 2020-2024
By Type of Product or Service
| TYPE OF PRODUCT OR SERVICE | NUMBER OF PPPs | PERCENT OF PPPs(45) |
| No Product or Service(46) | 43 | 24% |
| Any Product or Service(47) | 137 | 76% |
| Custodial or trustee services | 65 | 36% |
| Investment advice | 48 | 27% |
| Investment management | 78 | 43% |
| Investment products | 27 | 15% |
| Other administrative, fiduciary, or investment services | 59 | 33% |
| Plan administration | 115 | 64% |
NOTE: For this table, PPPs were counted using unique EIN. PPPs that did not provide
an EIN on Form PR are excluded from these counts.
SOURCE: Form PR filings for calendar years 2020-2024.
For the reasons described below this bulletin does not directly compare service provider reporting between the Form PR and Form 5500 Schedule C.
- Form PR asks PPPs to identify the types of products or services they or an affiliate provide. Because some PPPs operate more than one PEP, they may not provide the same products and services for every PEP and may use non-affiliated third-party providers.
- The six Form PR categories do not map directly to the 31 codes used on the Form 5500, so any comparisons would require assumptions.
- The Form 5500 does not require large plans that file Schedule C to report service providers that receive less than $5,000 in annual compensation. The Form PR, by contrast, does not set a minimum threshold for reporting the products and services that a PPP offers.
Conclusion
This bulletin provides statistics on the number of PPPs that have registered with the Department as of December 31, 2024, as well as the counts and characteristics of PEPs based on their Form 5500 filings for statistical year 2023.
The Department uses the information in this bulletin to better understand the prevalence of PEPs within the employer-sponsored retirement plan industry. Although 269 PEPs filed for statistical year 2023, the Department considered only 244 of those PEPs to be active, as determined through the presence of participants, assets, or participating employers with account balances. Active PEPs that operated in 2023 had 1.2 million participants and held $11.8 billion in assets, signaling that there is strong and growing interest in PEPs.
Statistical year 2023 was the first year that PEPs were required to list participating employers and report their corresponding contribution share and account balance information on the Schedule MEP.(48) From the Schedule MEP data, the Department can report that more than 39,000 employers participated in PEPs in 2023 (though 86 percent of these employers were attributable to one PEP).
For future research, the Department will continue identifying sources of data outside of the Form 5500 that could provide more information on the employers that participate in PEPs, such as firm age and industry. For subsequent bulletins, the Department anticipates using the same PEP identification method used this year. This will allow for analysis of year-over-year trends for PPPs, PEPs, participants, assets, and participating employers to better understand and quantify growth in this segment of the retirement plan market.
Appendix A: Data Preparation Details
This appendix describes the data preparation steps used to create the descriptive statistics in this bulletin.
Form PR Filing Population
- The research dataset for this bulletin consists of all Form PR filings for pooled plan providers with a non-blank “PPP_EIN” (and corresponding pooled employer plans) that filed a Form PR before January 1, 2025.
- The Department compiled each year’s data set using the filing’s “SIGNED_DATE.” For example, a filing submitted and signed on January 10, 2023 would be tabulated as a 2023 filing.
Pooled Plan Providers:
- The counts of “New PPPs” are based on a unique “PPP_EIN” field for a given “SIGNED_DATE” year. The “PPP_EIN” must also not have existed in any prior year’s data.
- “Terminating PPP” counts are based on “FINAL_FILING” indicators within a given year. The “Total PPP” count for a given year is calculated by adding “New PPP” and “Existing PPP” filings, and then subtracting the “Terminating PPP” counts. The resulting total is then carried forward to the “Existing PPP” count for the following year.
Pooled Employer Plan Counting Methodology
For this bulletin, the Department identified the universe of Pooled Employer Plans using the following steps:
- The Department generated a list of Form 5500 plan filings that attached the Schedule MEP and indicated that the plan was a PEP (Schedule MEP, Part I, Box C, variable MEP_TYPE_MULTIPLE_EMPLR_PLAN = '3').
- Next, the Department narrowed the list in one of two ways:
- Retained the plans that matched the EIN-PN fields from the Form PR (“PPP_EIN” plus “EMPLOYER_PLAN_PN”) to the Form 5500 filings that contained the same EIN-PNs (“SPONS_DFE_EIN” plus “SPONS_DFE_PN”);
OR - Retained the plans if the Schedule MEP listed a Form PR filing ACK_ID (Schedule MEP, Part III, Line 3b).
- Retained the plans that matched the EIN-PN fields from the Form PR (“PPP_EIN” plus “EMPLOYER_PLAN_PN”) to the Form 5500 filings that contained the same EIN-PNs (“SPONS_DFE_EIN” plus “SPONS_DFE_PN”);
This bulletin uses 2023 statistical year Form 5500 data pulled from the EFAST2 database on April 1, 2026. The data reflect filings submitted or amended as recently as March 26, 2026.
Participating Employers:
In Section III, “PEP Participating Employers”, the Department presents statistics on the employers participating in PEPs. In Figure III.2, the number of participating employers is based on the number of entries reported on each PEP’s Schedule MEP. In some cases, PEPs may list the same EIN multiple times, with different employer names and account balances.
Table III.4 in that same section introduces the idea of Unique Participating Employers. The Department defines this measure as a unique count of Employer EINs (“MEP_PARTICIPATING_EMPLR_EIN”) that appear on the Schedule MEP. This approach differs from the counts by PEP because it counts an employer EIN only once, even if the EIN is reported more than once on the same PEP’s Schedule MEP. It also counts an employer only once if the employer appears on more than one PEP.
Service Providers:
Table A.1: Service Code Grouping Definitions(49)
| Form 5500 Description | Form 5500 Codes |
| Services Provided | |
| Accounting | 10 |
| Actuarial | 11 |
| Claims processing | 12 |
| Consulting | 16, 17 |
| Copying and Duplicating | 36 |
| Custodial | 18, 19 |
| Employee | 30, 35 |
| Foreign Entity | 40 |
| Insurance | 22, 23 |
| Investment Mgmt and Advisory | 26, 27, 28 |
| Legal | 29 |
| Named Fiduciary | 31 |
| Other Services | 49 |
| Participant Communication | 38 |
| Participant Loan Processing | 37 |
| Plan/Contract Administrator | 13, 14 |
| Real Estate Brokerage | 32 |
| Recordkeeping | 15 |
| Securities Brokerage | 33 |
| Trustee | 20, 21, 24, 25 |
| Valuation | 34 |
| Compensation Received | |
| Consulting Fees | 70 |
| Direct Payment from Plan | 50 |
| Indirect--Commissions | 54, 55, 68, 71 |
| Indirect--Fees | 57, 58, 59, 60, 61, 63, 65, 72 |
| Insurance Fees | 53, 66, 67, 73 |
| Inv. Mgmt. Fees | 51, 52 |
| Other Fees or Revenue | 56, 62, 99 |
| Recordkeeping Fees | 64 |
Appendix B: Supplemental Tables
Schedule H Asset Breakout
Table B.1 – Detailed Balance Sheet for Large Pooled Employer Plans, 2023
By Type of Asset or Liability (millions)
| Type of Asset or Liability | 2023 |
| Total noninterest-bearing cash | $7 |
| Employer contrib. receivable | $32 |
| Participant contrib. receivable | $6 |
| Other receivables | $4 |
| Interest-bearing cash | $60 |
| U.S. Government securities | - |
| Corporate debt instruments | - |
| Preferred stock | - |
| Common stock | - |
| Partnership/joint venture interests | - |
| Real estate (other than employer real property) | - |
| Loans (other than to participants) | $4 |
| Participant loans | $135 |
| Assets in common/collective trusts | $3,689 |
| Assets in pooled separate accounts | $2,574 |
| Assets in master trusts | - |
| Assets in 103-12 investment entities | - |
| Assets in registered investment comp. | $4,406 |
| Assets in ins. co. general account | $337 |
| Other general investments | $65 |
| Employer securities | $24 |
| Employer real property | - |
| Buildings and other prop. used by plan | - |
| Other or unspecified assets | $328 |
| TOTAL ASSETS | $11,671 |
| Benefit claims payable | $2 |
| Operating payables | **/ |
| Acquisition indebtedness | **/ |
| Other liabilities | $5 |
| TOTAL LIABILITIES | $7 |
| NET ASSETS | $11,663 |
NOTES: Total asset amounts shown do not include the value of allocated insurance contracts of the type described in 29
CFR 2520.104-44. Some totals do not equal the sum of the components due to rounding.
**/ Less than $500,000
- Missing or zero.
SOURCE: Form 5500 filings for plan year ending in 2023.
Footnotes
- The registration requirement stems from the SECURE Act of 2019 and section 3(44) of the Employee Retirement Income Security Act (ERISA).↩
- https://www.dol.gov/agencies/ebsa/researchers/statistics/retirement-bulletins/pooled-employer-plan-bulletin.↩
- Participating employers in a PEP still retain fiduciary responsibility for the prudent selection and monitoring of the PPP and responsibility for decisions not delegated under the plan.↩
- As described in 29 CFR § 2510.3-44, in order to be a PPP for PEPs, a person or entity must register with the Department prior to beginning operations. Because the validity of a PPP hinges on their timely and complete Form PR registration, the Department relies in part on evidence of a Form PR registration in its methodology to determine the count of PEPs.↩
- Beginning with plan year 2022, the Department requires PEPs to use plan characteristic code ‘2W’ on Form 5500 Line 8a to indicate “Multiple-employer pension plan that is a pooled employer plan that meets the definition under ERISA section 3(43).”↩
- U.S. Department of Labor, Form PR and Instructions, 6, https://www.dol.gov/agencies/ebsa/employers-and-advisers/plan-administration-and-compliance/reporting-and-filing/form-pr. In the Form PR instructions, PPPs are referred to as a person or entity. The instructions explain on pg. 6, “Note. ‘Person’ for these purposes includes corporations, partnerships, and sole proprietorships.” Submitting a Form PR registration with the Department of Labor also satisfies the requirement under section 413(e)(3)(A)(ii) of the Internal Revenue Code to register with the Department of the Treasury.↩
- The Department does not report Form PR filing counts by filing reason due to inconsistent applications of the four different filing types across the PPP universe. For example, one PPP submitted 35 separate Form PR “initial filings” for the same EIN between 2020 and 2024.↩
- Form PR opened for filing in the EFAST2 system in November 2020, with the first filings received on November 25. PPPs could begin operating PEPs on January 1, 2021. ↩
- New PPPs are not based on the number of filers that indicate “Initial Filing” on their Form PR for two reasons. First, the Department found that some new entities (based on EIN) filed for the first time using other filing types. Second, the Department found that some existing PPPs submitted multiple initial filings under the same EIN. ↩
- The Department uses Form PR final filings to calculate the number of terminating PPPs that officially cease operations. It is possible that additional PPPs have ceased operations without formally submitting a final filing. ↩
- Prior to 2023, PEP filers submitted participating employer information as a non-machine-readable attachment.↩
- Even if a plan identifies as a PEP on the Form 5500, the Department recognizes the plan as a PEP only if it can confirm that the PPP registered through the Form PR. The Department excluded 11 Form 5500 Schedule MEP PEP filings from this analysis because it could not match them to a Form PR filing.↩
- In 2022, the Department created plan characteristic code “2W” for Form 5500 filers to report a plan’s status as a PEP. However, due to the Department’s Form 5500 reporting compliance program identifying a high percentage of “2W” code reporting errors, the Department does not rely on the “2W” code for its PEP bulletins.↩
- Applying the methodology used for last year's bulletin, there would be 271 PEPs for plan year 2023, versus the 269 counted under the new methodology. ↩
- Active participants are currently employed individuals covered by the plan who are earning or retaining credited service under the plan. Total participants include active participants, retired or separated participants receiving benefits, other retired or separated participants entitled to future benefits, and deceased participants whose beneficiaries are receiving or are entitled to receive benefits.↩
- The definition of active participants includes individuals who are eligible to elect to have the employer make payments to a 401(k)-type plan, even if individuals are not contributing, and nonvested individuals who are earning or retaining credited service under the plan. For more information, please see the Instructions for Form 5500 at https://www.dol.gov/agencies/ebsa/key-topics/reporting-and-filing/form-5500.↩
- The line item for “beneficiaries” reflects data from the Form 5500 Part II Item 6e, which reports on the number of deceased individuals whose beneficiaries are receiving or are entitled to receive benefits under the plan.↩
- Among the 244 active PEPs in statistical year 2023, 135 (55 percent) filed Schedule H and 109 (45 percent) filed Schedule I.↩
- PEPs that check the Part I, Line B box for first return/report to indicate they are submitting an initial filing for this PEP would use end-of-year participants with account balances to determine whether to file a Schedule H or I.↩
- Total assets shown do not include the value of allocated insurance contracts described in 29 C.F.R § 2520.104-44.↩
- This report defines Total Contributions as employer and employee contributions.↩
- While Schedule H breaks out benefit payments into three distinct categories, Schedule I does not. Because Table II.5 combines data from both schedules, the Total Benefits column represents all benefits paid by PEPs in statistical year 2023, including direct payments to participants and beneficiaries (including rollovers), payments made to insurance companies, and any other disbursements that fall into an “other” category. Amounts shown include benefits paid directly from trust funds and premium payments made by plans to insurance carriers. Amounts exclude benefits paid directly by insurance carriers.↩
- S&P Dow Jones Indices LLC, S&P 500 [SP500], retrieved from FRED, Federal Reserve Bank of St. Louis; https://fred.stlouisfed.org/series/SP500, March 31, 2026.↩
- Benefit Payments correspond to expenses reported on the Form 5500 Schedule H in Part II Line 2e(1), 2e(2), and 2e(3), which represents cash, securities or other property at the date of distribution (including rollovers), payments to insurance companies (such as for paid-up annuities), and payments to other organizations or individuals providing benefits.↩
- For Schedule H filers, "Administrative Expenses" is equal to the "Total Administrative Expenses" line item. For Schedule I filers, "Administrative Expenses" includes only the "Administrative Service Providers" line item.↩
- Funding and benefit payout arrangements are reported on items 9a and 9b of the Form 5500.↩
- Total asset amounts shown do not include the value of allocated insurance contracts described in 29 C.F.R 2520.104-44.↩
- PPPs that file Form PR are not required to establish and operate a PEP.↩
- The total number is the sum of registered PPPs and new PPPs minus terminating PPPs as of December 31 of a given calendar year. The Total PPP statistics in Table III.1 match the data presented in Table I.2 as of the end of 2023. ↩
- While Form PR data are available for filing years 2020-2024, Form 5500 data are only available for statistical year 2023.↩
- Because “operating PPP” is determined through the presence of Form 5500 filings for statistical year 2023 and total PPP is determined through the presence of a Form PR filing submitted during calendar years 2020-2024, the timing comparison is not perfectly aligned. For instance, a PPP that registers via a Form PR in December 2022 may not begin operating their PEP until statistical year 2023.↩
- From a statistical standpoint, the distribution of active PEPs per operating PPP is skewed to the right. The distribution is asymmetrical with a long right tail. Most values are below the average, with the most extreme values on the right side of the distribution, above the distribution average. ↩
- Of the 244 active PEPs for statistical year 2023, 13 did not report participating employer information in their Schedule MEP filing. Eight of these PEPs submitted participating employer information via attachment. Because PEPs must list participating employers in Part II of Schedule MEP, the Department’s reporting compliance program is working to correct this issue. Table III.3 and Figure III.2 show the distribution for the 239 PEPs that reported participating employer information either on Schedule MEP or in an attachment. ↩
- From a statistical standpoint, the distribution of participating employers per PEP is skewed to the right. The distribution is asymmetrical with a long right tail. Most values are below the average, with the most extreme values on the right side of the distribution, above the distribution average.↩
- The Bureau of Labor Statistics (BLS) Business Employment Dynamics (BDM) program matched EINs of employers participating in PEPs from the Form 5500 Schedule MEP to Quarterly Census of Employment and Wages (QCEW) business employment records. BLS matched 34,649 of the 39,446 (88 percent) PEP participating employer EINs. For more information, visit https://www.bls.gov/bdm/research-data.htm. ↩
- The average number of participants per unique participating employer was 29. This overall average was pulled down by the largest PEP by number of participating employers, which averaged only 16 participants per employer – suggesting this PEP includes a disproportionate share of small employers. Excluding this PEP, the average rises to 109 participants per employer.↩
- Aggregate account balance is the sum of the account balances of the employees of a given employer listed on Schedule MEP Part II (including the beneficiaries of such employees). ↩
- The participating employer section of the Schedule MEP does not provide a way to report the date an employer joins a PEP. The employers listed on a Schedule MEP include both employers that have participated in a PEP for some time and employers that recently joined. Some newly joined employers may have no participating employees with accounts at the time of Form 5500 reporting.↩
- Employers can participate in multiple PEPs. For statistical year 2023, 31 employers were reported as participating in more than one PEP. No employers participated in more than two PEPs.↩
- From a statistical standpoint, the distribution of aggregate account balances per PEP participating employer is skewed to the right. The distribution is asymmetrical with a long right tail. Most values are below the average, with the most extreme values on the right side of the distribution, above the distribution average.↩
- With respect to counting participants for this purpose, a plan that has between 80 and 120 participants for the year may file again as a small plan if it filed as a small plan for the prior plan year.↩
- Beginning with the 2023 plan year, the Department uses information reported on Form 5500 to determine whether a plan is small or large based on the number of participants with account balances at the beginning of the year. Though the other parts of this bulletin do not separate PEPs into small and large, the use of beginning of year participants with account balances differs from how other statistics are presented in this bulletin (e.g., assets and participants in prior sections are pulled based on end of year). ↩
- Total PEPs are unique plans, based on EIN-PN, that filed a Form 5500 during a given plan year. Plan size is determined by the count of participants with account balances at the beginning of the plan year, as described in the footnote above. ↩
- See Appendix A for more information about the Schedule C service code groups.↩
- To calculate percentages, the Department divided the number of PPPs in a given row by the total number of PPPs over the period 2020-2024 (defined as filing an initial registration via Form PR with a unique EIN). The total number of PPPs matches the sum of “New PPPs” in Table I.2.↩
- This measure is the total number of PPPs over the period 2020-2024 minus the number of PPPs that provide any product or service.↩
- This measure is the number of PPPs offering any type of product or service. Because some PPPs offer multiple products or services, the individual products/services do not sum to this number.↩
- For statistical years 2021 and 2022, plans complied with the SECURE Act 1.0 (P.L. 116-94) amendments to ERISA Section 103(g) by reporting participating employers via PDF attachment to Form 5500. During that period, Schedule MEP was developed and added for the 2023 form.↩
- A description of the service provider codes, as reported on Form 5500 Schedule C, Part I, Item 2b, can be found on the 2023 Form 5500 Instructions (pg. 30).↩