
Executive Summary
The Pooled Employer Plan bulletin presents data the Department of Labor receives on pooled plan providers (PPPs) and pooled employer plans (PEPs). This information helps the Department protect consumers by identifying PPPs, the services they provide, changes in the number of PEPs they offer, and the coverage and financial information of PEPs.
The Department requires a person or entity that intends to serve as a PPP and sponsor a PEP to use the Form PR(1) to register and report certain information, including the registrant's identifying information, compliance officials, legal agents, operating PEPs, trustees, and legal status of the PPP or its officials. These filings must be updated as needed in response to changes in PEP offerings and PPP status.
Like other employee benefit plans, PEPs must also file a Form 5500 annually to report the number of participants, assets, service providers, and other information to the Department. In this filing, PEPs must include a list identifying participating employers and their estimated share of total contributions and provide the unique receipt confirmation code for the most recent Form PR filed by the PEP's PPP.
The requirement to report this information became effective with the creation of PEPs in the SECURE Act of 2019 and subsequent regulations. This is the first bulletin the Department has produced since the legislation was enacted.
This bulletin presents statistics on PPPs based on Form PR filings submitted through December 31, 2023, and on PEPs based on statistical year 2021 and 2022 Form 5500 data. The various tables and graphs provide a snapshot of the current universe of PPPs and the PEPs that they sponsor.
The key statistics identified through this inaugural Pooled Employer Plan bulletin are:
- As of the end of 2023, there were 142 PPPs registered with the Department to provide PEPs.
- In statistical year 2022, there were 190 PEPs in operation, an increase of 135 percent from statistical year 2021.
- In statistical year 2022, PEPs reported 618,000 total participants, an increase of nearly 245 percent over statistical year 2021.
- In statistical year 2022, the top 20th percentile of PEPs held 87 percent of all PEP assets.
- Of the 118 PPPs who had registered with the Department using the Form PR by the end of 2022, only 68 (58 percent) reported operating a PEP on a Form 5500 filing for statistical year 2022.
- Although most PPPs operated a single PEP in statistical year 2022, 29 percent operated more than one, including one PPP that operated 18 separate PEPs.
Terminology
- Employer Identification Number (EIN): An EIN is a unique identification number assigned to an entity by the Internal Revenue Service. Several sections of the Form 5500 and Form PR require EIN reporting for identification purposes.
- Filing year: Filing year refers to the year that a form, such as a Form PR or a Form 5500 is submitted. This bulletin uses the term filing year to refer to the calendar year that a Form PR submission occurred (e.g., 2021 filing year would include all Form PR filings submitted during calendar year 2021).
- Form 5500 (Annual Return/Report): An annual report filed by employee benefit plans that contains information on a plan's assets, contributions, the number of participants, service providers, and insurance contracts, among other attributes. PEPs are required to file a single Form 5500 with the Department annually.
- Form 5500-SF (Short Form Annual Return/Report of Small Employee Benefit Plan): The Form 5500-SF, Short Form Annual Return/Report of Small Employee Benefit Plan, is a simplified annual reporting form for use by certain small pension and welfare benefit plans that meet a list of criteria (including having fewer than 100 participants at the beginning of the plan year). Regardless of their size, PEPs are not eligible to file a Form 5500-SF and must instead file a Form 5500.
- Form PR: The Form PR is used to report information for a person or entity that intends to serve as a pooled plan provider to a pooled employer plan within the meaning of sections 3(43) and 3(44) of the Employee Retirement Income Security Act of 1974 (ERISA) and section 413(e) of the Internal Revenue Code.
- Participant: ERISA section 3(7) defines "participant" as "any employee or former employee of an employer, or any member or former member of an employee organization, who is or may become eligible to receive a benefit of any type from an employee benefit plan."
- Plan Number (PN): The PN is a three-digit number that is self-assigned by the plan administrator for the entity. The PN is reported on the Form 5500 Part II Item 1d and the Form PR Part III Item 7b to distinguish among different plans that use the same EIN.
- Plan year: A period designated by a retirement plan for calculating vesting and eligibility, among other things. The plan year can be the calendar year or an alternative period, for example, July 1 to June 30.
- Pooled employer plan (PEP): A PEP is an individual account defined contribution retirement plan that provides benefits to the employees of at least two employers that do not have a common interest other than adopting the plan.
- Pooled plan provider (PPP): A PPP is the plan sponsor, a named fiduciary, and the plan administrator of the PEP.
- Statistical year: Statistical year refers to all Form 5500 employee benefit plan filings with a plan year ending date between January 1 and December 31 of a given year. This bulletin presents statistical year 2021 and 2022 data from the Form 5500, thus representing plans with plan years ending between January 1, 2021-December 31, 2021, and January 1, 2022-December 31, 2022, respectively.
Introduction
Multiple employer plans (MEPs) are retirement savings plans adopted by two or more employers that are unrelated for income tax purposes but share some common business element or are part of the same professional employer organization. Pooled employer plans (PEPs), established under the SECURE Act of 2019 as a type of open MEP, are individual account defined contribution retirement plans established or maintained to provide benefits to the employees of at least two employers that do not have a common interest other than adopting the plan.
PEPs must be sponsored and administered by a pooled plan provider (PPP), which assumes most of the administrative and fiduciary responsibilities of sponsoring a retirement plan. Participation in a PEP can reduce these responsibilities for the employer and can also limit their control over plan features and oversight. Because PEPs are likely large enough to offer diversified investment lineups at a lower cost than small plans typically negotiate on their own, they may be appealing to smaller employers who would otherwise find the administrative duties and expense in offering retirement benefits to be prohibitively burdensome. Lawmakers and the Department of Labor (the Department) anticipate that PEPs will therefore improve retirement savings for some American workers who previously had no access to an employer-sponsored retirement plan.
The Department requires that persons or entities that intend to serve as a PPP file a Form PR to report certain information. The Form PR does not have an annual filing requirement. Instead, specific events trigger the requirement to register and provide information via the Form PR. PPPs must file a Form PR prior to beginning operations, when a new PEP is offered, when a PEP is terminated, after certain changes to the initial registration, after correcting mistakes in prior filings, or after the PEP has submitted its final Form 5500 filing and the PPP is ceasing operations.
Each PEP is required to file a single Form 5500 annually. In addition to standard filing requirements, PEPs must:
- include the plan characteristic code indicating their status as a PEP,(2)
- identify participating employers,
- provide an estimate of the share of total contributions for each employer,
- indicate whether they have complied with the Form PR filing requirements and, if so,
- provide the unique filing identifier for the most recent Form PR filed by the PEP's PPP.
Data for this bulletin come from two sources: Form PR filings and Form 5500 filings. The bulletin is divided into four sections.
Section I presents statistics on Form PR filings from November 25, 2020, through December 31, 2023, focusing on information collected from the Form PR, including the total number of Form PR submissions since 2020, the filing purpose, and the universe of PPPs year-over-year.
Section II presents statistics on PEPs based on Form 5500 filings for statistical years 2021 and 2022, providing summary tables on participants, assets, contributions, benefits, funding arrangements, investment vehicles, and other characteristics of the PEPs.
Section III uses both Form PR and Form 5500 data to analyze operating PEPs and PPPs and the types of services they offer.
Section IV makes a few concluding observations.
Section I: Form PR Data
Any person or entity wishing to serve as a PPP must file a Form PR with the Department of Labor and Department of the Treasury.(3)
Unlike the Form 5500, the Form PR does not have an annual filing requirement. Instead, specific events trigger the requirement to register and provide information via the Form PR. These can be divided into four sets of filing obligations.
- Initial Registration Filings, which provide basic identifying information about PPPs. Registrations must be filed at least 30 days before beginning operations. Only one registration must be filed for each PPP regardless of the number of PEPs it operates.
Supplemental Filings, which are used to report certain information in addition to what was reported in the initial filing or a previous supplemental filing. Supplemental filings fall into one of the following four categories:
- change in information previously reported,
- new or terminating PEP,
- other changes in PPP circumstances, and
- removal of criminal information based on acquittal.
Supplemental filings are due within the later of 30 days after the calendar quarter in which specified events occurred or 45 days after the actual event.
- Amended Filings, which are used to correct inadvertent or good faith errors and/or omissions on a previously filed Form PR. Amended filings must be submitted as soon as is reasonable upon discovering an error in a prior filing.
- Final Filings, which occur when an entity has ceased operating all PEPs and terminated operations. PPPs must complete the final filing within the later of (a) 30 days after the calendar quarter in which the final Form 5500 for the last PEP operated by the PPP was filed or (b) 45 days after such filing.
Because the Form PR does not have an annual filing requirement, filings are not tied to a specific plan year. For this bulletin, the Department tabulated filings based on the submission date in the EFAST system. For example, 2021 data include all Form PR filings submitted from January 1, 2021, to December 31, 2021. The Department refers to this period as "filing year 2021."
Number of Filings and Filing Purposes
Table I.1 shows the number of Form PR filings per filing year for each of the four filing reasons. While a PPP is expected to submit only one initial filing and one final filing, there is no limit on the number of supplemental or amended filings. The data show that PPPs submit multiple supplemental and amended filings.
In total, there were 716 Form PR filings during the period 2020-2023, including 269 initial filings for new PPPs. Filing year 2023 saw the highest volume of total filings, driven largely by a substantial increase in the number of amended filings that were submitted during that year. Excluding amended filings, filing year 2021 saw the highest volume, with initial, supplemental, and final Form PR filings decreasing over filing years 2022 and 2023.
| Filing Year | Initial Filings | Supplemental Filings | Amended Filings | Final Filings | Total Filings |
|---|---|---|---|---|---|
| 2020(4) | 36 | 2 | 2 | 0 | 40 |
| 2021 | 91 | 68 | 91 | 5 | 245 |
| 2022 | 72 | 63 | 35 | 4 | 169 |
| 2023 | 70 | 52 | 143 | 2 | 262 |
| Total | 269 | 185 | 271 | 11 | 716 |
Note: Form PR filers may indicate more than one filing reason on a single Form PR submission. Thus, the Total Filings column (which reflects unique filings, even if more than one filing reason was indicated) is less than the sum of the individual filing reasons shown in the table.
Source: Form PR filings for filing years 2020-2023.
Table I.2 shows the universe of PPPs over the period 2020-2023. Statistics are presented as of December 31 of a given filing year (e.g., 2021 statistics are totals as of December 31, 2021). PPPs were counted using unique EINs within a given filing year. This method differs from Table I.1, which displays the raw totals of Form PR filings received by the Department.
To calculate the total number of PPPs for a given filing year, the Department started with registered PPPs, which are equal to total PPPs from the prior filing year. Next, the Department added new PPPs, which are defined as PPPs filing a Form PR under a new EIN (i.e., the EIN appears for the first time in the Form PR database).(5) Finally, the Department subtracted terminating PPPs, which are defined as PPPs that submitted a final filing within a given filing year.
As of December 31, 2023, there were 142 PPPs, a 20 percent increase from the total as of December 31, 2022. Calendar year 2021 saw the highest number of new PPPs, with 60 new PPPs registering with the Department that year. The number of new PPPs has decreased since the 2021 peak, falling to 25 new PPPs in 2023.
Notably, the data show only seven terminating PPPs from 2020 to 2023.(6) There was just one PPP that officially ceased operations in 2023.
| Measure | 2020 | 2021 | 2022 | 2023 |
|---|---|---|---|---|
| Registered PPPs | 0 | 31 | 87 | 118 |
| New PPPs | 31 | 60 | 34 | 25 |
| Terminating PPPs(7) | 0 | 4 | 3 | 1 |
| Total PPPs | 31 | 87 | 118 | 142 |
Source: Form PR filings for filing years 2020-2023.
Among the 142 PPPs that had registered with the Department as of the end of 2023, a handful appear to have a common affiliation, where the same person is reported as the compliance official and form signer across multiple PPPs. This suggests that the PPP market may be more consolidated than is immediately apparent from a count based on unique EINs.
Section II: Form 5500 Data
PEPs are required to file a single Form 5500 Annual Return/Report. Employers participating in a PEP do not file the Form 5500 individually. Instead, the PPP files the Form 5500 on behalf of the PEP, which must include an attachment listing all participating employers.(8) PEPs are ineligible to file the Form 5500-SF, regardless of size (even if the plan has fewer than 100 participants).
Because PEPs are required to file a Form 5500 annually, the Department considers the Form 5500 to be the best way of determining the number of PEPs operating in a given statistical year. Within the Form 5500 universe, there are multiple ways to identify PEP filings.
Beginning in 2022, the Department created plan characteristic code "2W" for Form 5500 filers to report a plan's status as a PEP. However, the Department does not rely on the plan characteristic code for this bulletin for two reasons. First, the code wasn't available for the 2021 statistical year data. Second, the Department's Form 5500 reporting compliance program determined that a high percentage of plans that used the "2W" code and did not submit a Form PR filing had used the "2W" PEP code erroneously.(9)
Ultimately, the Department constructed the PEP dataset for this bulletin by identifying all Form 5500 filings for PEPs reported on a Form PR, based on the EIN-PN reported on both forms.(10)
This section summarizes Form 5500 data filed by PEPs for statistical years 2021 and 2022. The information presented includes counts of plans and participants for PEPs and their assets, contributions, and benefits.
Number of Plans and Participants
To identify the number of PEPs operating in a statistical year, the Department looked for EIN-PN matches between the Form 5500 and Form PR filings. Only PEPs that filed both a Form 5500 during statistical year 2021 and/or 2022 and matched a Form PR filing are included in this section's tables and analysis.
As shown in Figure II.1, there were 190 PEPs in operation in statistical year 2022, an increase of nearly 135 percent from statistical year 2021, which was the first year PEPs were authorized to operate. Of the 190 PEPs, 116 were large plans (plans with 100 or more participants) and 74 were small plans (plans with fewer than 100 participants).(11) From 2021 to 2022, the number of large PEPs increased by nearly 214 percent and small PEPs increased by 68 percent.
Figure II.1: Number of Pooled Employer Plans by Statistical Year
(2021-2022) 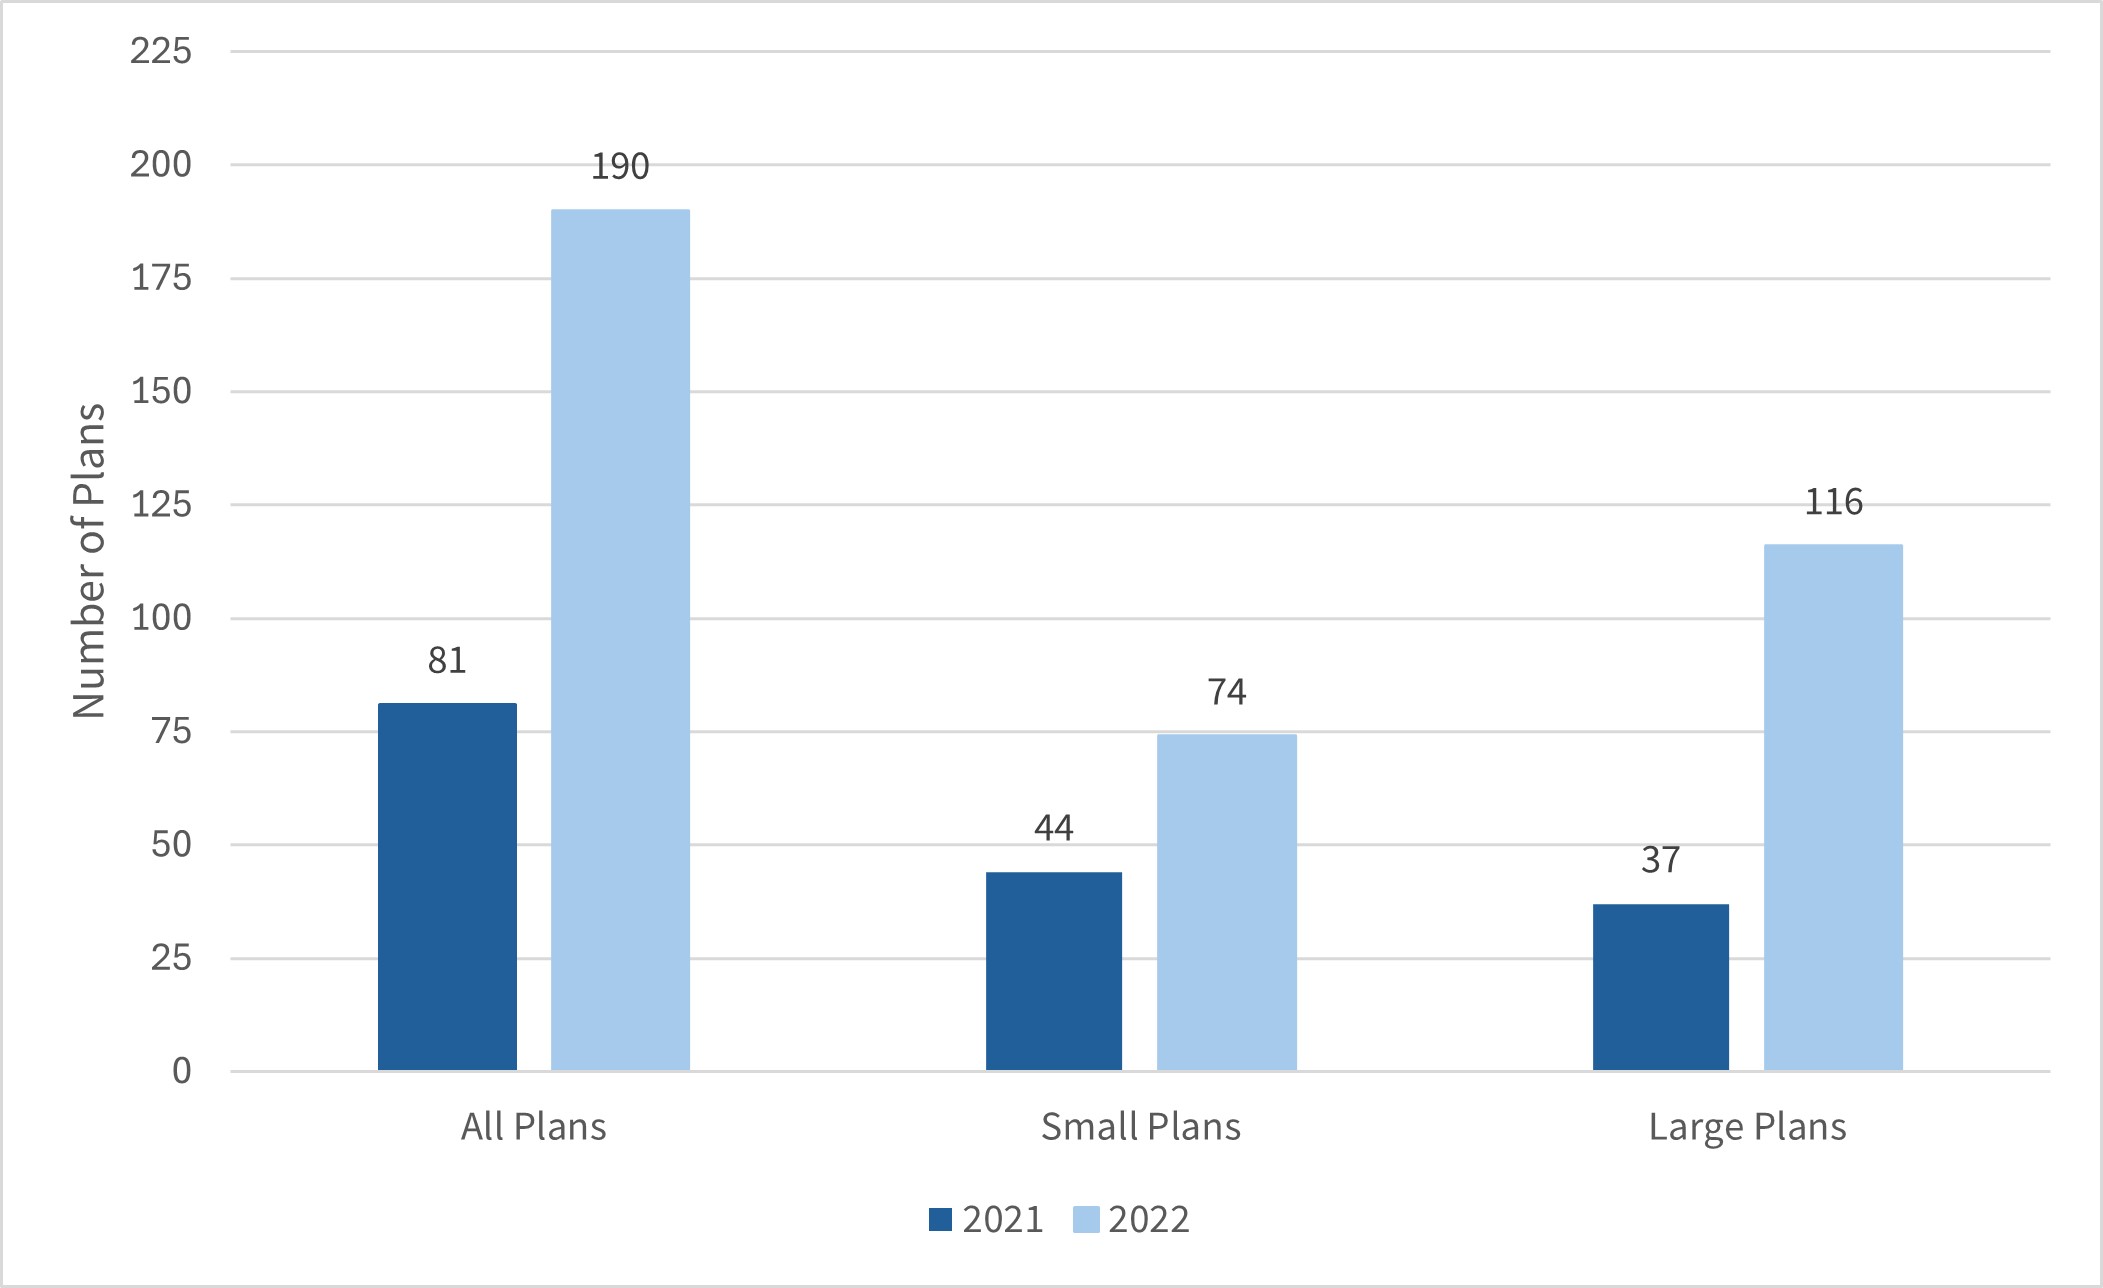
Source: Form 5500 filings for plan years ending in 2021-2022.
Table II.1 explores changes in plan size between statistical years 2021 and 2022. The vast majority (98 percent) of the 81 plans that filed in 2021 also filed in 2022. Just two plans that filed in 2021 did not file in 2022. In terms of plan size, 18 small plans in 2021 grew to become large plans in 2022. Conversely, three large plans in 2021 fell below the 100-participant threshold to become small plans in 2022. Among the 111 "new" filings in 2022 (defined as plans that filed in 2022, but did not file in 2021), 64 were large PEPs and 47 were small.
| 2021 Plan Size | 2022 Plan Size | |||
|---|---|---|---|---|
| Small Plan | Large Plan | Not Filed | Total Plans | |
| Small Plan | 24 | 18 | 2 | 44 |
| Large Plan | 3 | 34 | 0 | 37 |
| Not Filed(12) | 47 | 64 | 0 | - |
| Total Plans | 74 | 116 | - | - |
Note: Row totals represent all plans in statistical year 2021. Column totals represent all plans in statistical year 2022.
Source: Form 5500 filings for plan years ending in 2021-2022.
The Department used Form 5500 filings to aggregate total and active plan participants, as shown in Table II.2.(13) In statistical year 2022, the number of total participants grew by 439,000 participants, a 245 percent increase over 2021. The number of active participants increased by 242 percent from 2021 to 2022. The vast majority (over 99 percent) of both total and active PEP participants were in large plans.
| Plan Year | Number of Plans | Total Participants (thousands) | Active Participants (thousands) |
|---|---|---|---|
| All Plans | |||
| 2021 | 81 | 179 | 165 |
| 2022 | 190 | 618 | 565 |
| Large Plans (100 or More End of Year Participants) | |||
| 2021 | 37 | 178 | 164 |
| 2022 | 116 | 615 | 563 |
| Small Plans (Fewer than End of Year 100 Participants) | |||
| 2021 | 44 | 1 | 1 |
| 2022 | 74 | 2 | 2 |
Note: Totals are tabulated as of the end of the plan year.
Source: Form 5500 filings for plan years ending in 2021-2022.
Form 5500 Part II (Basic Plan Information) requires PEPs to report additional information on participants and beneficiaries, including the status of non-active participants and how many participants have account balances. The Department aggregated these filings for statistical years 2021 and 2022 to create Table II.3.
Of the 618,000 participants reported by PEPs in statistical year 2022, 565,000 were active, 3,000 were retired or separated participants receiving benefits, and 50,000 were other retired or separated participants with a vested right to benefits. The composition of participants by type was similar in statistical years 2021 and 2022. Active participants comprised 92 percent of total PEP participants in 2021 and 91 percent in 2022. Other retired or separated participants with vested rights to benefits comprised 8 percent in both years.
The percentage of PEP participants with account balances slightly decreased in statistical year 2022. In 2021, nearly 44 percent of PEP participants had account balances compared to nearly 43 percent of PEP participants in 2022.
| Type of Participant | 2021 | 2022 |
|---|---|---|
| Active Participants | 165 | 565 |
| Retired or Separated Participants Receiving Benefits | */ | 3 |
| Other Retired or Separated Participants with Vested Right to Benefits | 14 | 50 |
| Total Participants | 179 | 618 |
| Participants with Account Balances | 78 | 263 |
| Beneficiaries(14) | */ | */ |
| Total Participants and Beneficiaries | 179 | 618 |
Notes: Participants are tabulated as of the end of the plan year.
Some totals do not equal the sum of the components due to rounding
*/ Fewer than 500 participants.
Source: Form 5500 filings for plan years ending in 2021-2022.
Pooled Employer Plan Assets
The Department examined the Form 5500 Schedule H or I for PEP filers to understand the finances of PEPs. Schedules H and I capture financial information for plans, including assets, liabilities, contributions and expenses. Schedule H is used for large plans (100 or more end of year participants). Schedule I is used for small plans (fewer than 100 end of year participants). Table II.4 shows the total assets, contributions, and benefits of PEPs in statistical years 2021 and 2022.
In statistical year 2022, PEPs held roughly $5 billion in total assets, a 224 percent increase from statistical year 2021. Total contributions to PEPs increased by 362 percent, to $1.1 billion. Large PEPs held 98 percent of PEP assets and accounted for 98 percent of reported PEP contributions.
Examining the distribution of PEP assets by quintile (shown in Figure II.2) shows that the top 20th percentile of PEPs in statistical year 2022 held 87 percent of all assets. While total PEP assets in statistical year 2021 were significantly less than statistical year 2022, they were similarly distributed. The fact that assets are concentrated in relatively few plans signals that some PEPs in this market have an outsized impact on coverage.
Figure II.2: Distribution of Pooled Employer Plan Assets
2021-2022 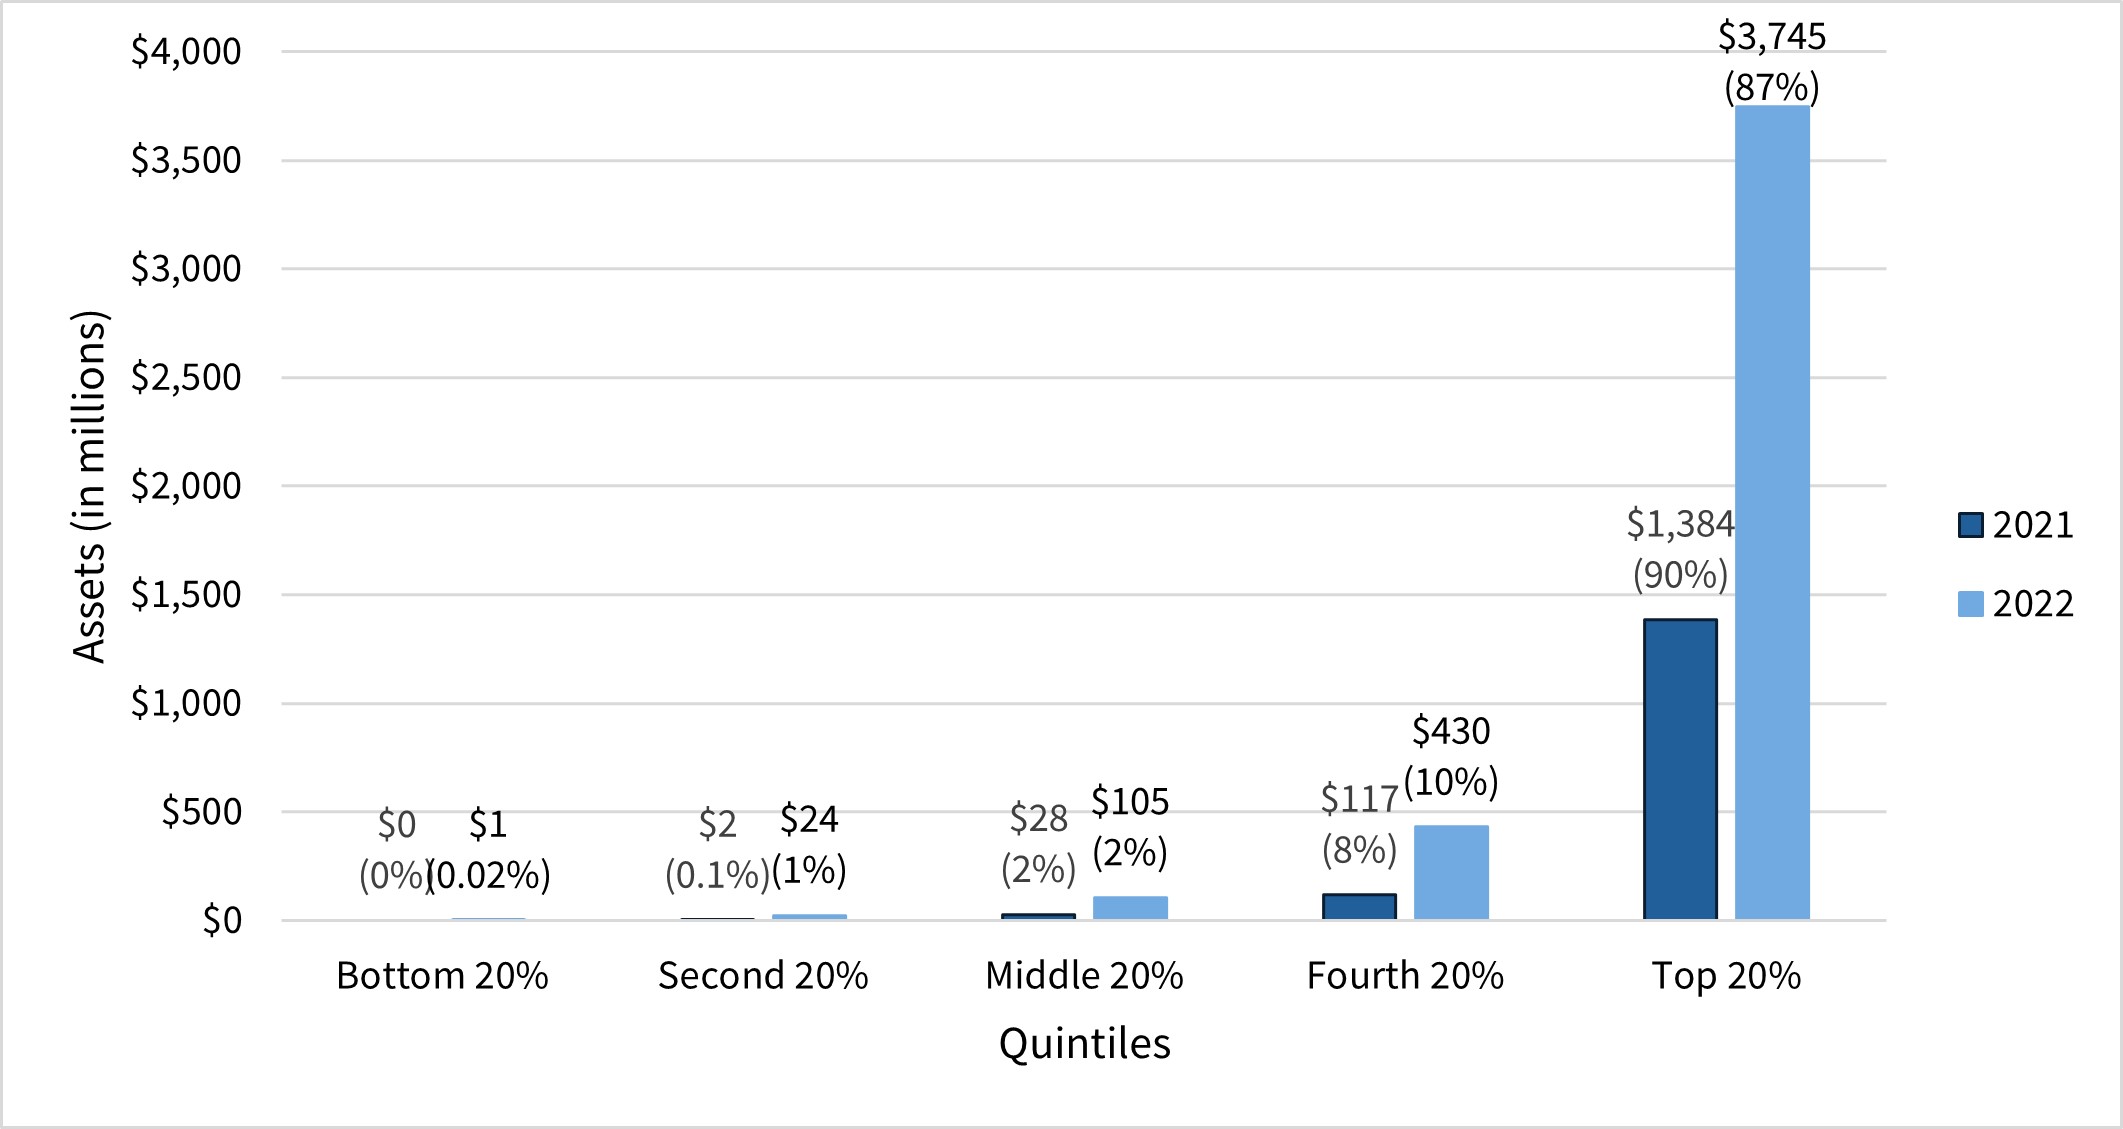
Source: Form 5500 filings for plan years ending in 2021-2022.
PEPs disbursed roughly $410 million for payment of benefits in statistical year 2022, with $404 million disbursed from large PEPs and $5 million disbursed from small PEPs. These payments were made either directly to retirees, beneficiaries, and terminating employees or to insurance carriers for payment of benefits. These amounts reflect a 306 percent increase in total disbursements for PEPs compared to statistical year 2021.
Overall, PEPs disbursed $718 million less than they received in contributions during statistical year 2022.
| Plan Year | Number of Plans | Total Assets (millions)(15) | Total Contributions (millions)(16) | Total Benefits (millions)(17) |
|---|---|---|---|---|
| All Plans | ||||
| 2021 | 81 | $1,532 | $244 | $101 |
| 2022 | 190 | $4,969 | $1,128 | $410 |
| Large Plans (100 or More End of Year Participants) | ||||
| 2021 | 37 | $1,496 | $239 | $100 |
| 2022 | 116 | $4,869 | $1,108 | $404 |
| Small Plans (Fewer than 100 End of Year Participants) | ||||
| 2021 | 44 | $36 | $5 | **/ |
| 2022 | 74 | $100 | $19 | $5 |
Notes: Totals are tabulated as of the end of the plan year.
**/ Less than $500,000.
Source: Form 5500 filings for plan years ending in 2021-2022.
Like other pension plans, PEPs use the Form 5500 financial reporting schedules to indicate the asset categories for their financial holdings and investments. Table II.5 is calculated by aggregating similar asset categories from Schedules H or I and the Form 5500-SF filings.(18)
However, the table presents the aggregated asset categories in a similar format to Schedule I of the Form 5500. All asset categories that appear on the more detailed Schedule H but not the Schedule I are grouped under the "Other Investments" category. This includes receivables, interest and non-interest-bearing cash, registered investment companies, common collective trusts, pooled separate accounts, and other general or unspecified assets. More detailed Schedule H asset categories are available for large plans in the Private Pension Plans bulletin.(19)
In the statistical year 2021 and 2022 data, PEP filings did not report any assets in the "Partnership/Joint Venture Interests," "Employer Real Property," and "Real Estate (Other Than Employer Real Property)" categories. The "Other Investments" category held the largest share of PEP assets in both years.
| Type of Asset or Liability | 2021 | 2022 |
|---|---|---|
| Partnership/Joint Venture Interests | - | - |
| Employer Real Property | - | - |
| Real Estate (Other Than Employer Real Property) | - | - |
| Employer Securities | **/ | $9 |
| Participant Loans | $16 | $58 |
| Loans (Other Than to Participants) | **/ | $1 |
| Other Investments | $1,478 | $4,869 |
| Form 5500-SF Assets(20) | $37 | $33 |
| Total Assets | $1,532 | $4,969 |
| Total Liabilities(21) | $39 | **/ |
| Net Assets | $1,493 | $4,969 |
Notes: Assets and liabilities are tabulated as of the end of the plan year.
Some totals do not equal the sum of the components due to rounding
**/ Less than $500,000.
- Missing or zero.
Source: Form 5500 filings for plan years ending in 2021-2022.
While the categories in Table II.5 allow for a consistent reporting of assets for PEPs of all sizes by mirroring the Schedule I reporting categories, the Schedule H provides a more detailed breakout of the assets shown in the "Other Investments" category (see Appendix Table B.1). As presented in that breakout for 2021 and 2022, large PEPs held 81 percent and 89 percent of their assets, respectively, in common collective trusts, pooled separate accounts, and registered investment companies.
Like Table II.5 above, Table II.6 presents Schedules H, I, and Form 5500-SF PEP income and expenses based on Form 5500 Schedule I reporting categories. All income and expense items that appear on the more detailed Schedule H but not the Schedule I are grouped under the "All Other Income" or "Other or Unspecified Expenses" categories. These items include interest earnings, dividends, rents, and several line items reporting realized or unrealized gains/losses on investments.
In statistical years 2021 and 2022, PEPs' largest share of income was from "Participant Contributions." Income reported in the "All Other Income" category fell dramatically from 2021 to 2022, presumably because most of the category was tied to investment returns, and stock market performance declined in 2022.(22) Due to this shift in market performance, in statistical year 2022, contributions from employers, participants, and others comprised a larger share of PEP income than the "All Other Income" amount.
Most PEP expenses were due to benefits paid out to participants and beneficiaries. "Administrative Expenses" averaged roughly 4 percent of total expenses for statistical years 2021 and 2022.
| Income | 2021 | 2022 |
|---|---|---|
| Employer Contributions | $46 | $262 |
| Participant Contributions | $130 | $654 |
| Contribution from Others (including Rollovers) | $68 | $210 |
| Noncash Contributions | - | $1 |
| All Other Income | $117 | -$521 |
| Total Income | $361 | $607 |
| Expenses | 2021 | 2022 |
|---|---|---|
| Total Benefit Payments(23) | $101 | $410 |
| Certain Deemed and/or Corrective Distributions | $1 | $4 |
| Administrative Expenses(24) | $4 | $18 |
| Other or Unspecified Expenses | **/ | **/ |
| Total Expenses | $105 | $432 |
| Net Income | $256 | $175 |
Notes: Some totals do not equal the sum of the components due to rounding.
**/ Less than $500,000
- Missing or zero.
Source: Form 5500 filings for plan years ending 2021-2022.
Form 5500 pension filers are required to indicate the plan's method of funding and benefit payouts on their returns.(25) Filers can indicate more than one arrangement for their funding and benefit payments. The Department grouped the arrangement options into "Insurance," "Section 412(i) Insurance," "Trust," "Trust and Insurance," and "General Assets of the Sponsor." The Department also created a category for the assets held by Form 5500-SF filers.(26)
Table II.7 presents PEP assets by method of funding arrangement.(27) In statistical years 2021 and 2022, PEPs using the "Trust and Insurance" method reported the largest share of PEP assets compared to other categories. The "Trust" method held the second largest amount of assets.
| Funding Arrangement for Investment of Assets | 2021 | 2022 |
|---|---|---|
| Insurance | $26 | $42 |
| Section 412(i) Ins. | - | - |
| Trust | $686 | $1,877 |
| Trust and Insurance | $783 | $3,017 |
| General Assets of the Sponsor | - | - |
| Form 5500-SF(28) | $37 | $33 |
| Total(29) | $1,532 | $4,969 |
| Funding Arrangement for Payment of Benefits | 2021 | 2022 |
|---|---|---|
| Insurance | $26 | $42 |
| Section 412(i) Ins. | - | - |
| Trust | $686 | $1,904 |
| Trust and Insurance | $783 | $2,991 |
| General Assets of the Sponsor | - | - |
| Form 5500-SF | $37 | $33 |
| Total | $1,532 | $4,969 |
Notes: Assets are tabulated as of the end of the plan year.
Some totals do not equal the sum of the components due to rounding.
- Missing or zero.
Source: Form 5500 filings for plan years ending in 2021-2022.
Section III: Hybrid Analysis
Operating PEPs and PPPs
PPPs file the Form PR to register with the Department and indicate their intention to operate a PEP.(30) Once a PPP establishes a PEP, it is then required to file the Form 5500 annually to report information on the assets and participants of each PEP.
For the tables in this section, PPPs are defined using the unique EIN reported on the Form PR. PEPs are identified by their Form 5500 filings and mapped to their sponsoring PPP using the EIN.
Table III.1 compares "operating PPPs" (defined as PPPs that filed Form 5500 for an active PEP within a given statistical year) versus "total PPPs" (defined as the total number(31) of PPPs registered with the Department via Form PR as of December 31 of a given filing year). As Table III.1 is populated using both Form PR and Form 5500 data, comparison is only possible for 2021 and 2022.(32) Note that filing year and statistical year is not a one-to-one comparison.(33)
A little more than half of all PPPs operate an active PEP with participating employers and enrolled participants. This percentage increased from 51 percent in 2021 to 58 percent in 2022.
| Year | Operating PPPs | Total PPPs | Percent of PPPs Operating |
|---|---|---|---|
| 2021 | 44 | 87 | 51% |
| 2022 | 68 | 118 | 58% |
Source: Form PR filings (2020-2022) and Form 5500 filings (plan years ending in 2021-2022).
Table III.2 shows the distribution of active PEPs per operating PPP for statistical years 2021 and 2022 based on Form 5500 filings. While there is no limit on the number of PEPs a PPP can operate, Table III.2 shows that most PPPs operate a single PEP. However, there are some larger PPPs that operate multiple PEPs. These larger PPPs appear to be affecting the average number of PEPs per operating PPP, which increased from two in statistical year 2021 to three in statistical year 2022.(34)
| Statistical Year | Operating PPPs | PEPs per Pooled Plan Provider | |||
|---|---|---|---|---|---|
| Minimum | Average | Median | Maximum | ||
| 2021 | 44 | 1 | 2 | 1 | 11 |
| 2022 | 68 | 1 | 3 | 1 | 18 |
Source: Form 5500 filings for plan years ending in 2021-2022.
Figure III.1 is a histogram of active PEPs per operating PPP for statistical years 2021 and 2022 based on Form 5500 filings. Each histogram bin displays the number of PPPs operating PEPs within the given range. For example, a PPP operating seven PEPs would be included in the 5-8 bin.
Most PPPs operate a single PEP, though this percentage decreased from 77 percent of operating PPPs in statistical year 2021 to 71 percent in statistical year 2022. Additionally, the number of PPPs operating more than eight PEPs increased from 2 percent of operating PPPs in statistical year 2021 to 9 percent in statistical year 2022, suggesting that an increasing number of PPPs are sponsoring multiple PEPs.
Figure III.1: Histogram of Active PEPs per Operating Pooled Plan Provider
(2021-2022) 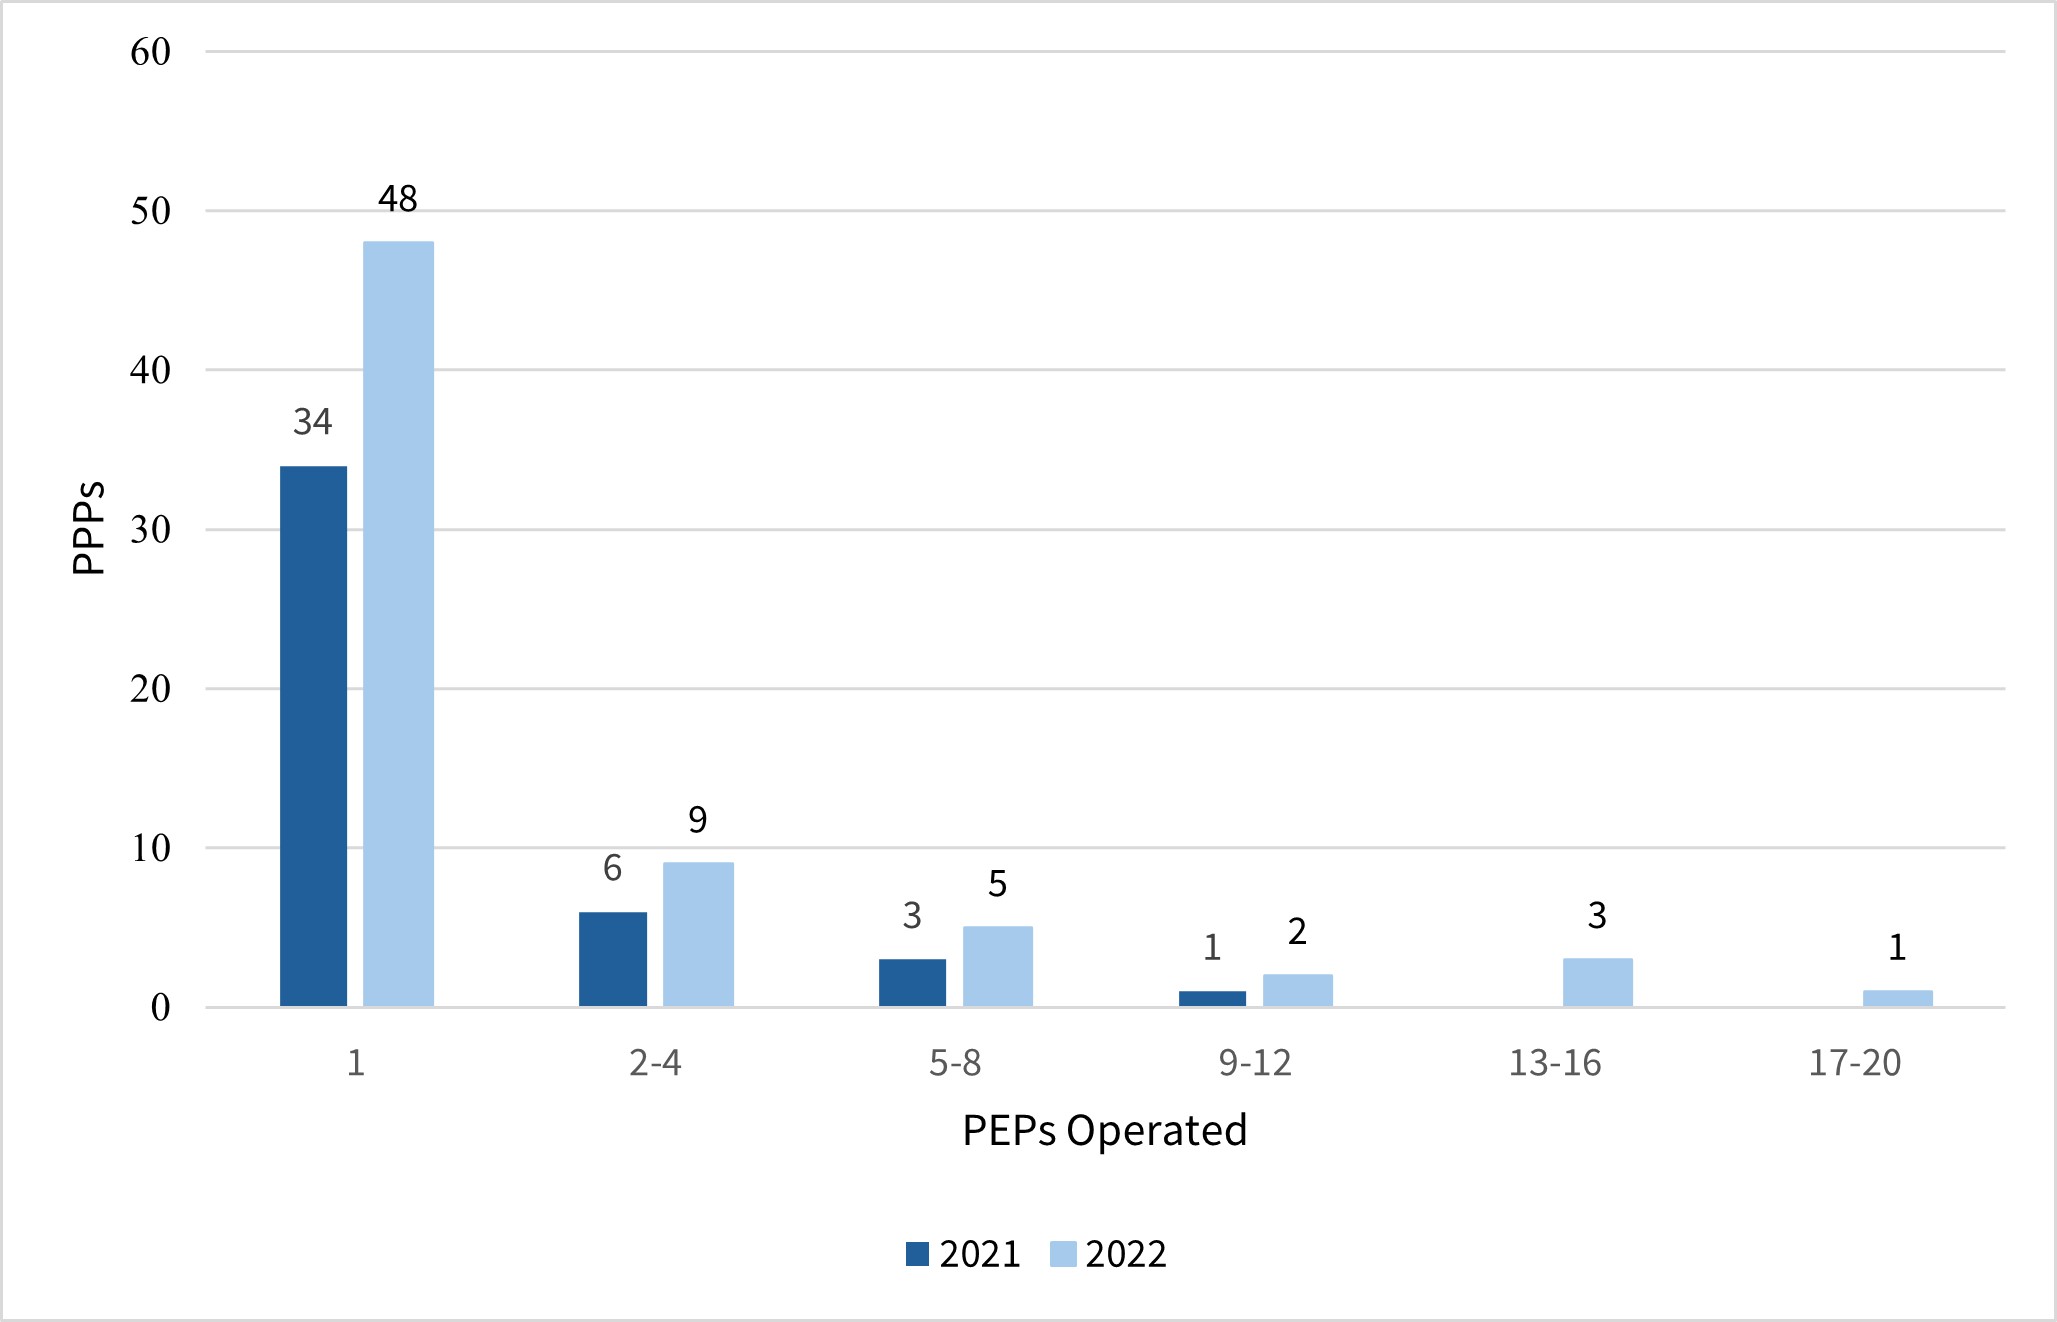
Source: Form 5500 filings for plan years ending in 2021-2022.
Services Offered by PEPs and PPPs
To better understand the types of offered by PEPs, the Department examined the Form 5500 Schedule C data on service providers for PEP filings. The Form 5500 Schedule C is used to report the types of received by plans, which providers performed those services, and the paid to those service providers by plans. While Schedule C data provides a picture of potential that PEPs offer, the data reported may not capture all service providers because:
- only plans with 100 or more participants(36) on the first day of the plan year are required to report on service providers through the Schedule C,(37)
- only service provider that is at least $5,000 (whether direct or indirect) is reported on the Schedule C, and
- the Schedule C does not require PPPs to report paid directly to them by employers participating in the plan.
While PEPs with fewer than 100 participants at the beginning of the year are not required to file a Schedule C, several did. Table III.3 presents both the total PEPs that included a Schedule C in their reporting, as well as a subset limited to the large plans that were required to file the Schedule C.
| Year | PEPs Filing Sched C | Total PEPs(38) | Percent of PEPs Filing Sched C |
|---|---|---|---|
| All Plans | |||
| 2021 | 24 | 81 | 30% |
| 2022 | 83 | 190 | 44% |
| Large Plans (100 or More Beginning of Year Participants) | |||
| 2021 | 12 | 16 | 75% |
| 2022 | 69 | 82 | 84% |
Notes: Totals are tabulated as of the end of the plan year.
Source: Form 5500 filings for plan years ending in 2021 and 2022.
Among all PEPs whose PPP registered with the Department through the Form PR and filed a Form 5500 for statistical year 2021, only 30 percent filed a Schedule C as well. This number increased for PEPs that filed a statistical year 2022 Form 5500, with 44 percent filing a Schedule C. Of the PEP population that meets the Schedule C filing plan size requirement, 75 percent and 84 percent of PEPs in 2021 and 2022, respectively, submitted a Schedule C with their Form 5500 filing.
When filling out the Schedule C, plans choose from 31 service codes that describe the provided and 24 codes that describe the type of received. Plans are instructed to enter as many codes as apply. To simplify the service and fee categories for this report, the Department grouped service codes(39) into 29 unique categories for Table III.4, which presents the most prevalent provided and/or arrangements for PEPs that filed a Form 5500 Schedule C in statistical years 2021 and 2022.
The top reported by PEPs that met the plan size filing requirement were plan/contract administrator, recordkeeping, investment management and advisory services, and participant loan processing. It is worth noting that some PPPs reported the they provide to the PEP on the Schedule C, with the PPP itself being listed as a person or entity receiving compensation, while other PPPs did not report themselves on the Schedule C at all, even for that they are statutorily required to provide (such as named fiduciary).
In 2022, only 28 percent of PEPs with 100 or more participants at the beginning of the year reported engaging with a service provider who served as a named fiduciary.(40) The PPP reported itself on the Schedule C for all occurrences of this service. Since all PPPs must serve as a named fiduciary, the 72 percent of PEP filings that did not report the PPP as performing the "named fiduciary" function either:
- received directly from participating employers,
- did not receive $5,000 or more in for that service, or
- did not report all of the PPPs' itemized on the Schedule C for which they received $5,000 or more in compensation.
| Service Code | Percent of PEPs Reporting | |
|---|---|---|
| 2021 | 2022 | |
| Services Provided | ||
| Accounting | 25% | 12% |
| Actuarial | 0% | 0% |
| Claims Processing | 17% | 18% |
| Consulting | 42% | 43% |
| Copying and Duplicating | 0% | 3% |
| Custodial | 25% | 13% |
| Employee | 0% | 0% |
| Foreign Entity | 0% | 0% |
| Insurance | 0% | 1% |
| Investment Mgmt and Advisory | 83% | 78% |
| Legal | 0% | 0% |
| Named Fiduciary | 0% | 28% |
| Other Services | 25% | 21% |
| Participant Communication | 42% | 38% |
| Participant Loan Processing | 58% | 54% |
| Plan/Contract Administrator | 50% | 65% |
| Real Estate Brokerage | 0% | 0% |
| Recordkeeping | 50% | 68% |
| Securities Brokerage | 8% | 6% |
| Trustee | 33% | 26% |
| Valuation | 0% | 15% |
| Compensation Received | ||
| Consulting Fees | 8% | 3% |
| Direct Payment from Plan | 67% | 43% |
| Indirect-- Fees | 50% | 35% |
| Indirect—Commissions | 17% | 13% |
| Insurance Fees | 8% | 12% |
| Inv. Mgmt. Fees | 58% | 59% |
| Other Fees or Revenue | 33% | 40% |
| Recordkeeping Fees | 67% | 71% |
Source: Form 5500 Schedule C filings, plan years ending in 2021 and 2022.
Though not as detailed as what is reported on the Form 5500, the Form PR asks the PPP to report on whether the PPP or an affiliate will offer one of six categories of products or related to administration and investment oversight.
This data from the Form PR (as shown in Table III.5) shows that the majority of PPPs (77 percent) reported offering at least one of the listed service or product categories, with plan administration being the most commonly reported service at 65 percent.
| Type of Product or Service | Number of PPPs | Percent of PPPs(42) |
|---|---|---|
| No Product or Service(43) | 35 | 23% |
| Any Product or Service(44) | 115 | 77% |
| Custodial or trustee services | 51 | 34% |
| Investment advice | 44 | 29% |
| Investment management | 69 | 46% |
| Investment products | 23 | 15% |
| Other administrative, fiduciary, or investment services | 53 | 35% |
| Plan administration | 97 | 65% |
Note: For this table, PPPs were counted using unique EIN. PPPs that did not provide an EIN on Form PR are excluded from these counts. There was one such PPP over the period 2020-2023.
Source: Form PR filings for calendar years 2020-2023.
For several reasons, this bulletin does not include a direct comparison of service provider reporting consistency for PEPs with a Form 5500 Schedule C filing.
First, the Form PR asks for the PPP to identify the types of products or they or an affiliate provide. Because some PPPs operate more than one PEP, the PPP may not provide the same products and for all PEPs and could use third-party non-affiliates to provide services.
Second, the 6 broad product or service categories on the Form PR would require assumptions to map to the 31 codes that Form 5500 filers used to identify the type of service provided.
Lastly, while the Form 5500 does not require large plans that file Schedule C to report service providers receiving less than $5,000 in annual compensation, the Form PR does not limit reporting on the products and offered by a PPP below a certain threshold, further complicating a direct comparison between Form PR and Form 5500 service provider reporting.
Conclusion
This bulletin provides statistics on the number of PPPs that have registered with the Department as of December 31, 2023, as well as the counts and characteristics of PEPs based on their Form 5500 filings for statistical years 2021 and 2022.
The Department uses the information in this bulletin to better understand the growth of PEPs within the employer-provided retirement plan industry. Between filing year 2022 and 2023, the number of PPPs registered to operate PEPs increased by 20 percent. Between statistical years 2021 and 2022, the number of reported PEPs increased by 135 percent and the number of participants covered by PEPs increased by 245 percent.
Beginning with statistical year 2023, the Department will be able to extract additional information about employers participating in PEPs from the Form 5500, due to the requirement for PEPs to attach the new Schedule MEP. Therefore, next year's bulletin will allow for further observation of whether year-over-year trends for PPPs, PEPs, and participants continue to demonstrate growth. It will also contain baseline statistics of the number of employers participating in PEPs.
Appendix A: Data Preparation Details
This appendix provides details on the data preparation steps used to create the various descriptive statistics.
Form PR Filing Population
- The research dataset for this bulletin consists of all Form PR filings for pooled plan providers with a valid "PPP_EIN" (and corresponding pooled employer plans) that filed a Form PR before January 1, 2024.
- Each year's dataset was compiled using the filing's "SIGNED_DATE." For example, if the filing was submitted and signed on January 10, 2021, that filing would be tabulated as a 2021 filing.
Pooled Plan Providers
- The counts of "New PPPs" are based on a unique "PPP_EIN" field for a given "SIGNED_DATE" year. The "PPP_EIN" must also not have existed in any prior year's data.
- "Terminating PPP" counts are based on "FINAL_FILING" indicators within a given year.
- The "Total PPP" figure of a given year would sum the "New PPP" and "Existing PPP" filings, while subtracting the "Terminating PPP" counts. The resulting "Total PPP" counts would be carried forward to the "Existing PPP" figure for the following year.
Form 5500 Matches
For this bulletin, the Department performed the Form PR and Form 5500 filing matches using the following steps:
- The Department appended the "PPP_EIN" (Line 1e) and non-blank "EMPLOYER_PLAN_PN" (Line 7b) variables from all Form PR filings.
- The Department compared and matched the "EIN-PN" fields from the Form PR to the Form 5500 filings that contained the same EIN-PNs.
- In the event where there were multiple matches, the Department tried to match the filings for the same year for both Form PR and Form 5500 filings.
- In some instances, the "EIN-PN" variable from the Form PR matched to Form 5500-SF filings. Even though PEPs are not supposed to file the Form 5500-SF, the Department decided to retain and report the Form 5500-SF data for this bulletin. The Department is working with plans that erroneously filed Form 5500-SF to receive amended filings using Form 5500. This bulletin reflects data that has not yet fully resolved this reporting issue.
This method identified 81 and 190 matches for 2021 and 2022, respectively.
Service Providers
| Form 5500 Description | Form 5500 Codes |
|---|---|
| Services Provided | |
| Accounting | 10 |
| Actuarial | 11 |
| Claims processing | 12 |
| Consulting | 16, 17 |
| Copying and Duplicating | 36 |
| Custodial | 18, 19 |
| Employee | 30, 35 |
| Foreign Entity | 40 |
| Insurance | 22, 23 |
| Investment Mgmt and Advisory | 26, 27, 28 |
| Legal | 29 |
| Named Fiduciary | 31 |
| Other Services | 49 |
| Participant Communication | 38 |
| Participant Loan Processing | 37 |
| Plan/Contract Administrator | 13, 14 |
| Real Estate Brokerage | 32 |
| Recordkeeping | 15 |
| Securities Brokerage | 33 |
| Trustee | 20, 21, 24, 25 |
| Valuation | 34 |
| Compensation Received | |
| Consulting Fees | 70 |
| Direct Payment from Plan | 50 |
| Indirect--Commissions | 54, 55, 68, 71 |
| Indirect--Fees | 57, 58, 59, 60, 61, 63, 65, 72 |
| Insurance Fees | 53, 66, 67, 73 |
| Inv. Mgmt. Fees | 51, 52 |
| Other Fees or Revenue | 56, 62, 99 |
| Recordkeeping Fees | 64 |
Appendix B: Supplemental Tables
Schedule H Asset Breakout
| Type of Asset or Liability | 2021 | 2022 |
|---|---|---|
| Total noninterest-bearing cash | $2 | $20 |
| Employer contrib. receivable | $7 | $25 |
| Participant contrib. receivable | **/ | $3 |
| Other receivables | **/ | $2 |
| Interest-bearing cash | $5 | $47 |
| U.S. Government securities | - | - |
| Corporate debt instruments | - | - |
| Preferred stock | - | **/ |
| Common stock | - | - |
| Partnership/joint venture interests | - | - |
| Real estate (other than employer real property) | - | - |
| Loans (other than to participants) | - | $1 |
| Participant loans | $16 | $57 |
| Assets in common/collective trusts | $375 | $1,568 |
| Assets in pooled separate accounts | $255 | $830 |
| Assets in master trusts | - | - |
| Assets in 103-12 investment entities | - | - |
| Assets in registered investment comp. | $576 | $1,929 |
| Assets in ins. co. general account | $64 | $137 |
| Other general investments | $9 | $32 |
| Employer securities | - | - |
| Employer real property | - | - |
| Buildings and other prop. used by plan | - | - |
| Other or unspecified assets | $185 | $217 |
| TOTAL ASSETS | $1,496 | $4,869 |
| Benefit claims payable | - | - |
| Operating payables | - | **/ |
| Acquisition indebtedness | - | - |
| Other liabilities | $39 | **/ |
| TOTAL LIABILITIES | $39 | **/ |
| NET ASSETS | $1,457 | $4,868 |
Notes: Total asset amounts shown do not include the value of allocated insurance contracts of the type described in 29 CFR 2520.104-44. Some totals do not equal the sum of the components due to rounding.
**/ Less than $500,000
- Missing or zero.
Source: Form 5500 filings for plan years ending in 2021 and 2022.
Footnotes
- The registration requirement stems from section 3(44) of the Employee Retirement Income Security Act (ERISA). ↩
- Beginning with plan years beginning in 2022, the Department requires PEPs to use plan characteristic code '2W' to indicate "Multiple-employer pension plan that is a pooled employer plan that meets the definition under ERISA section 3(43)." ↩
- U.S. Department of Labor, Form PR and Instructions, 6, https://www.dol.gov/agencies/ebsa/employers-and-advisers/plan-administration-and-compliance/reporting-and-filing/form-pr. In the Form PR instructions, PPPs are referred to as a person or entity. The instructions explain on pg. 6, "Note. 'Person' for these purposes includes corporations, partnerships, and sole proprietorships." Submitting a Form PR registration with the Department of Labor also satisfies the requirement under section 413(e)(3)(A)(ii) of the Internal Revenue Code to register with the Department of the Treasury. ↩
- Form PR opened for filing in the EFAST system in November 2020, with the first filings received on November 25. PPPs could begin operating PEPs on January 1, 2021. ↩
- New PPPs are not based on the number of filers that indicate “Initial Filing” on their Form PR, as the Department found that some new entities (based on EIN) were filing for the first time using other filing types. ↩
- The Department uses Form PR final filings to calculate the number of terminating PPPs that officially cease operations. It is possible that additional PPPs have ceased operations without formally submitting a final filing. ↩
- Note that some PPPs submit multiple final filings for the same EIN. As this table uses unique EIN to count PPPs, the number of terminating PPPs differs from the number of final filings in Table I.1 (which displays the raw totals). ↩
- Beginning with the 2023 Form 5500, PEP filers are required to report on the participating employers through the Schedule MEP. For years before 2023, the list of employers was included as a non-machine-readable attachment. ↩
- There were 14 Form 5500 filings that indicated the PEP characteristic code of “2W” in their filing for plan year ending 2022 that are not part of our universe of PEP filings because we did not find a matching EIN-PN on the Form PR or didn't include it for other reasons, such as recognizing that it was a duplicate plan filing. ↩
- Plans filing as defined benefit plans are excluded. By definition, a pooled employer plan is a type of defined contribution plan. ↩
- Though this bulletin refers to small and large plans, it should be noted that a large PEP could be composed of many small employers. ↩
- Row and column totals are not listed for the Not Filed category because these plans did not submit a Form 5500 for the respective statistical year. ↩
- The definition of active participants includes individuals who are eligible to elect to have the employer make payments to a 401(k)-type plan (even if individuals are not contributing) and nonvested individuals who are earning or retaining credited service under the plan. For more information, please see the Instructions for Form 5500 at https://www.dol.gov/agencies/ebsa/employers-and-advisers/plan-administration-and-compliance/reporting-and-filing/form-5500. ↩
- The line item for "beneficiaries" reflects data from the Form 5500 Part II Item 6e, which reports on the number of deceased individuals whose beneficiaries are receiving or are entitled to receive benefits under the plan. ↩
- Total asset amounts shown do not include the value of allocated insurance contracts described in 29 C.F.R § 2520.104-44. ↩
- This report defines Total Contributions as employer and employee contributions. ↩
- Amounts shown include both benefits paid directly to participants and beneficiaries from trust funds and premium payments made by plans to insurance carriers. Amounts exclude benefits paid directly by insurance carriers. ↩
- All PEPs, regardless of size, are required to file a Form 5500. However, there were some instances where the Department was able to match a PEP listed in the Form PR database with a Form 5500-SF filing. These Form 5500-SF filing assets were aggregated and listed in Table II.5 under the "Form 5500-SF Assets" category. The Department's reporting compliance program is working with PPPs that erroneously filed Form 5500-SF to receive amended filings using Form 5500. This bulletin reflects data that has not yet fully resolved this reporting issue. ↩
- Schedule H asset categories for large plans in the Private Pension Plans bulletin are for defined contribution plans as a whole, not PEPs specifically. ↩
- Though the Department is working to ensure filers are aware that PEPs are not permitted to file a Form 5500-SF, a few PPPs reported operating a PEP on the Form PR that matched the EIN-PN of a plan filing the Form 5500-SF. These are not excluded from the tables in this report in order to present a fulsome picture of the PEP universe. ↩
- The drop in liabilities from 2021 to 2022 is due entirely to a large PEP that reported $39 million in liabilities at end-of-year on their 2021 Form 5500 filing and reported no liabilities the following year. ↩
- S&P Dow Jones Indices LLC, S&P 500 [SP500], retrieved from FRED, Federal Reserve Bank of St. Louis; https://fred.stlouisfed.org/series/SP500, April 10, 2025. ↩
- Benefit Payments correspond to expenses reported on the Form 5500 Schedule H in Part II Line 2e(1), 2e(2), and 2e(3), which represents cash, securities or other property at the date of distribution (including rollovers), payments to insurance companies (such as for paid-up annuities), and payments to other organizations or individuals providing benefits. ↩
- For Schedule H filers, "Administrative Expenses" is equal to the "Total Administrative Expenses" line item, while for Schedule I filers, "Administrative Expenses" includes only the "Administrative Service Providers" line item. ↩
- Funding and benefit payout arrangements are reported on items 9a and 9b of the Form 5500. ↩
- PEPs are not supposed to file the Form 5500-SF. The Department included the assets for these PEP filers in Table II.7 as separate category because the plans filing Form 5500-SF do not disclose the funding arrangement for investment of assets or payment of benefits. ↩
- For PEPs that filed the Form 5500 for statistical year 2021, the methods used to hold and invest plan assets were the same methods used to provide benefits to participants, thus the assets reported for funding and benefit payout arrangements are identical. ↩
- While PEPs are not supposed to file Form 5500-SF, 11 plans did so in 2021 only, 8 plans did so in 2022 only, and 13 did so in both 2021 and 2022. Plans filing Form 5500-SF do not disclose the funding arrangement for investment of assets or payment of benefits. ↩
- Total asset amounts shown do not include the value of allocated insurance contracts described in 29 C.F.R 2520.104-44. ↩
- PPPs that file Form PR are not required to establish and operate a PEP. ↩
- The total number is the sum of registered PPPs and new PPPs minus terminating PPPs as of December 31 of a given calendar year. The Total PPP statistics in Table III.1 match the data presented in Table I.2. ↩
- While Form PR data are available for filing year 2023, data for Form 5500 statistical year 2023 are not. ↩
- Because "operating PPP" is determined through the presence of Form 5500 filings for statistical years 2021 and 2022 and total PPP is determined through the presence of a Form PR filing submitted during calendar years 2021 and 2022, the timing comparison is not perfectly aligned. For instance, a PPP that registers via a Form PR in December 2022 may not begin operating their PEP until statistical year 2023. ↩
- From a statistical standpoint, the distribution of active PEPs per operating PPP is skewed to the right. The distribution is asymmetrical, with a long right tail. Most values are below the average, with the most extreme values on the right side of the distribution, above the distribution average. ↩
- Operating PPPs are defined as PPPs that filed the Form 5500 for a PEP within a given statistical year. ↩
- With respect to counting participants for this purpose, a plan that has between 80 and 120 participants for the year may file again as a small plan if it filed as a small plan for the prior plan year. ↩
- The Form 5500 criteria of using plan year beginning participant counts as the determination of whether a plan is small or large differs from this bulletin's use of end of plan year for all statistics. This explains why Table III.3 shows 16 and 82 large PEPs in 2021 and 2022, whereas Table II.4 shows 34 and 116 large PEPs. Because the beginning of year participant count determines the requirement for a Schedule C reporting, the Department deviates from the 'end of year' definition in this section only. ↩
- Total PEPs are defined as unique plans (based on EIN-PN) that filed a Form 5500 during a given plan year. ↩
- See Appendix A for more information about the Schedule C service code groups. ↩
- In 2021, no large PEPs reported the "named fiduciary" service provider on the Schedule C. ↩
- Table III.4 only presents statistics on services and compensation for PEPs whose plan size triggers a requirement to file the Schedule C. It excludes reported service provider information for "voluntary" Schedule C filers (12 small PEPs in 2021 and 14 small PEPs in 2022). ↩
- Percentages were calculated by dividing the number of PPPs in a given row by the total number of PPPs over the period 2020-2023 (defined as filing a Form PR under a unique EIN). ↩
- This measure is the total number of PPPs over the period 2020-2023 minus the number of PPPs that provide any product or service. ↩
- This measure is the number of PPPs offering any type of product or service. Because some PPPs offer multiple products or services, the individual products/services do not sum to this number. ↩
- A description of the service provider codes, as reported on Form 5500 Schedule C, Part I, Item 2b, can be found on the 2022 Form 5500 instructions (pg. 8). ↩