Find the most recent annual averages for selected labor force characteristics. Data are presented by sex, age, race and Hispanic origin, educational attainment, marital status, and parental status when available.
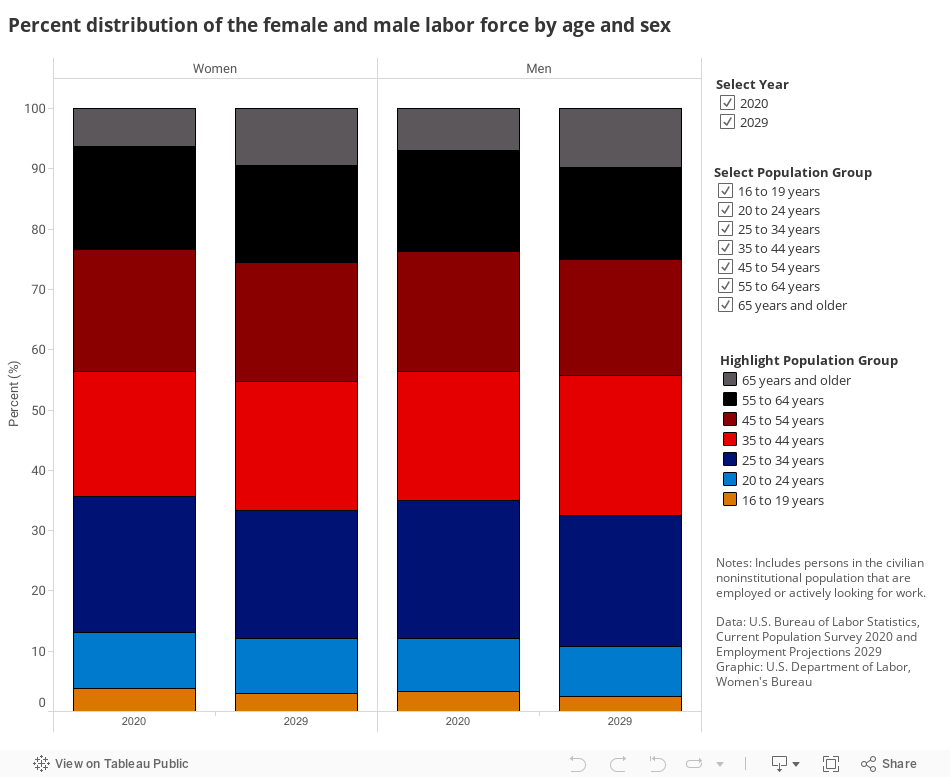
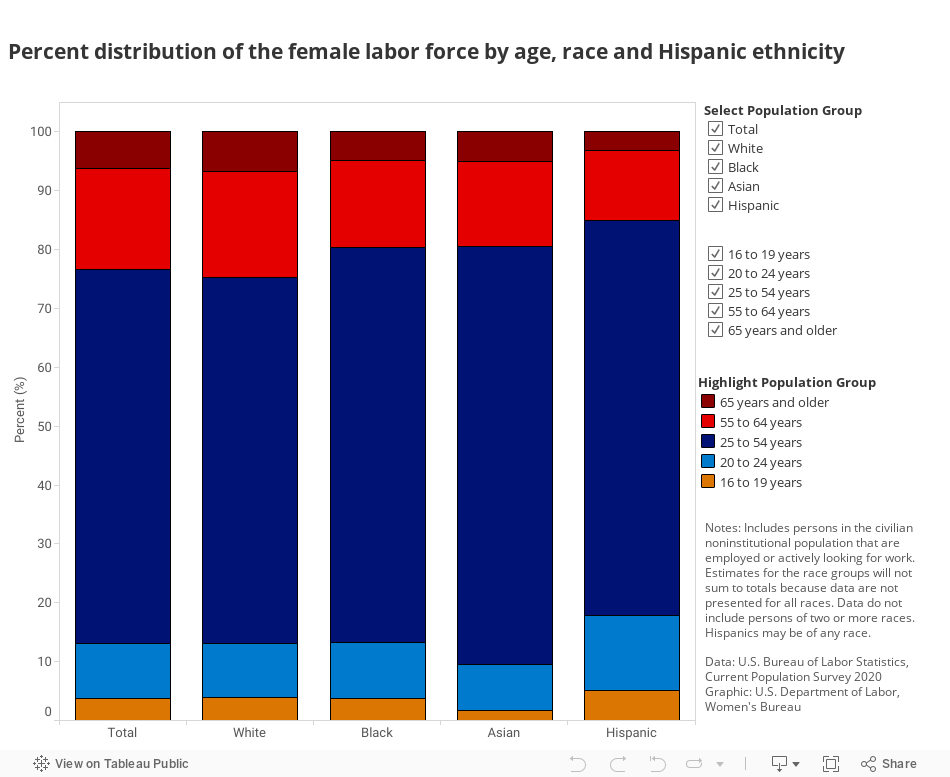
Civilian Noninstitutional Population by Sex, Race and Hispanic Ethnicity
View text version of the Civilian Noninstitutional Population by Sex, Race and Hispanic Ethnicity
Sex, race and Hispanic ethnicity | 2016 Annual Averages - (population in thousands) | 2016 Annual Averages - (population in percentages) | 2024 Projections - (population in thousands) | 2024 Projections - (population in percentages) |
---|---|---|---|---|
Total | 253,538 | 100 | 269,092 | 100 |
White | 198,215 | 78.2 | 207,570 | 77.1 |
Black | 31,889 | 12.6 | 34,769 | 12.9 |
Asian | 15,121 | 6 | 17,143 | 6.4 |
Other | 8,312 | 3.3 | 9,609 | 3.6 |
Hispanic | 40,697 | 16.1 | 49,272 | 18.3 |
Women | 131,040 | 51.7 | 138,366 | 51.4 |
White | 101,354 | 40 | 105,613 | 39.2 |
Black | 17,365 | 6.8 | 18,819 | 7 |
Asian | 8,057 | 3.2 | 9,173 | 3.4 |
Other | 4,265 | 1.7 | 4,760 | 1.8 |
Hispanic | 20,430 | 8.1 | 24,334 | 9 |
Men | 122,497 | 48.3 | 130,726 | 48.6 |
White | 96,861 | 38.2 | 101,957 | 37.9 |
Black | 14,525 | 5.7 | 15,950 | 5.9 |
Asian | 7,064 | 2.8 | 7,970 | 3 |
Other | 4,047 | 1.6 | 4,849 | 1.8 |
Hispanic | 20,266 | 8 | 24,938 | 9.3 |
Based on persons 16 years of age and older.The "other" category includes persons of two or more races and the racial categories of American Indian and Alaska Native; and Native Hawaiian and Other Pacific Islanders. Hispanics may be of any race.
Source: 2016 Current Population Survey and 2024 Employment Projections, U.S. Bureau of Labor Statistics
Labor Force by Sex, Race and Hispanic Ethnicity
View text version of the Labor Force by Sex, Race and Hispanic Ethnicity
Sex, Race and Hispanic Ethnicity | 2016 Annual Averages - (population in thousands) | 2016 Annual Averages (population in percentages) | 2024 Projections - (population in thousands) | 2024 Projections - (population in percentages) |
---|---|---|---|---|
Total | 159,187 | 100 | 163,770 | 100 |
White | 124,658 | 78.3 | 126,143 | 77 |
Black | 19,637 | 12.3 | 20,772 | 12.7 |
Asian | 9,562 | 6 | 10,792 | 6.6 |
Other | 5,330 | 3.3 | 6,063 | 3.7 |
Hispanic | 26,797 | 16.8 | 32,486 | 19.8 |
Women | 74,432 | 46.8 | 77,246 | 47.2 |
White | 57,095 | 35.9 | 58,294 | 35.6 |
Black | 10,321 | 6.5 | 11,089 | 6.8 |
Asian | 4,471 | 2.8 | 5,111 | 3.1 |
Other | 2,545 | 1.6 | 2,752 | 1.7 |
Hispanic | 11,401 | 7.2 | 13,964 | 8.5 |
Men | 84,755 | 53.2 | 86,524 | 52.8 |
White | 67,564 | 42.4 | 67,849 | 41.4 |
Black | 9,315 | 5.9 | 9,683 | 5.9 |
Asian | 5,091 | 3.2 | 5,681 | 3.5 |
Other | 2,785 | 1.7 | 3,311 | 2 |
Hispanic | 15,396 | 9.7 | 18,522 | 11.3 |
Includes persons in the civilian noninstitutional population 16 years of age and older that are employed or actively looking for work. The "other" category includes persons of two or more races and the racial categories of American Indian and Alaska Native; and Native Hawaiian and Other Pacific Islanders. Hispanics may be of any race.
Source: 2016 Current Population Survey and 2024 Employment Projections, U.S. Bureau of Labor Statistics
Percent Distribution of the Labor Force by Age and Sex
View text version of the Percent Distribution of the Labor Force by Age and Sex
Sex, race and Hispanic ethnicity | 2016 Annual Averages - (population in thousands) | 2016 Annual Averages (population in percentages) | 2024 Projections - (population in thousands) | 2024 Projections - (population in percentages) |
---|---|---|---|---|
Women | ||||
16 to 19 years | 2,894 | 3.9 | 2,102 | 2.7 |
20 to 24 years | 7,359 | 9.9 | 6,871 | 8.9 |
25 to 34 years | 16,369 | 22 | 16,885 | 21.9 |
35 to 44 years | 15,134 | 20.3 | 16,350 | 21.2 |
45 to 54 years | 16,019 | 21.5 | 15,513 | 20.1 |
55 to 64 years | 12,527 | 16.8 | 13,292 | 17.2 |
65 years and older | 4,130 | 5.5 | 6,235 | 8.1 |
Men | ||||
16 to 19 years | 2,995 | 3.5 | 2,242 | 2.6 |
20 to 24 years | 7,954 | 9.4 | 7,284 | 8.4 |
25 to 34 years | 19,151 | 22.6 | 20,002 | 23.1 |
35 to 44 years | 17,686 | 20.9 | 19,624 | 22.7 |
45 to 54 years | 17,890 | 21.1 | 16,324 | 18.9 |
55 to 64 years | 13,938 | 16.4 | 13,862 | 16 |
65 years and older | 5,141 | 6.1 | 7,186 | 8.3 |
Includes persons in the civilian noninstitutional population that are employed or actively looking for work.
Source: 2016 annual averages, Current Population Survey, U.S. Bureau of Labor Statistics
Percent Distribution of the Female Labor Force by Age, Race, and Hispanic Ethnicity
Race and Hispanic ethnicity, age | Number in the female labor force (in thousands) | Share of the female labor force (percent) |
---|---|---|
Total | ||
16 to 19 years | 2,894 | 3.9 |
20 to 24 years | 7,359 | 9.9 |
25 to 54 years | 47,522 | 63.8 |
55 to 64 years | 12,527 | 16.8 |
65 years and older | 4,130 | 5.5 |
White | ||
16 to 19 years | 2,224 | 3.9 |
20 to 24 years | 5,471 | 9.6 |
25 to 54 years | 35,721 | 62.6 |
55 to 64 years | 10,195 | 17.9 |
65 years and older | 3,484 | 6.1 |
Black | ||
16 to 19 years | 379 | 3.7 |
20 to 24 years | 1,168 | 11.3 |
25 to 54 years | 6,994 | 67.8 |
55 to 64 years | 1,399 | 13.6 |
65 years and older | 383 | 3.7 |
Asian | ||
16 to 19 years | 88 | 2 |
20 to 24 years | 342 | 7.6 |
25 to 54 years | 3,168 | 70.9 |
55 to 64 years | 680 | 15.2 |
65 years and older | 192 | 4.3 |
Hispanic | ||
16 to 19 years | 557 | 4.9 |
20 to 24 years | 1,536 | 13.5 |
25 to 54 years | 7,803 | 68.4 |
55 to 64 years | 1,196 | 10.5 |
65 years and older | 308 | 2.7 |
Includes persons in the civilian noninstitutional population that are employed or actively looking for work. Estimates for the race groups will not sum to totals because data are not presented for all races. Data do not include persons of two or more races. Hispanics may be of any race.
Source: 2016 annual averages, Current Population Survey, U.S. Bureau of Labor Statistics
Educational Attainment of the Labor Force by Sex, Race and Hispanic Ethnicity
Race and Hispanic ethnicity, educational attainment | Women (labor force in thousands) | Women (labor force in percentage) | Men (labor force in thousands) | Men (labor force in percentage) |
---|---|---|---|---|
All | ||||
Less than a high school diploma | 3,876 | 6 | 6,803 | 9.2 |
High school graduates, no college | 14,888 | 23.2 | 20,760 | 28.1 |
Some college, no degree | 10,865 | 16.9 | 11,803 | 16 |
Associate degree | 8,076 | 12.6 | 7,191 | 9.7 |
Bachelor's degree | 16,258 | 25.3 | 17,127 | 23.2 |
Advanced degree | 10,216 | 15.9 | 10,123 | 13.7 |
White | ||||
Less than a high school diploma | 2,843 | 5.8 | 5,586 | 9.5 |
High school graduates, no college | 11,293 | 22.9 | 16,582 | 28.1 |
Some college, no degree | 8,148 | 16.5 | 9,314 | 15.8 |
Associate degree | 6,380 | 12.9 | 5,903 | 10 |
Bachelor's degree | 12,797 | 25.9 | 13,841 | 23.4 |
Advanced degree | 7,939 | 16.1 | 7,862 | 13.3 |
Black | ||||
Less than a high school diploma | 595 | 6.8 | 649 | 8.2 |
High school graduates, no college | 2,434 | 27.7 | 2,751 | 34.9 |
Some college, no degree | 1,927 | 22 | 1,584 | 20.1 |
Associate degree | 1,124 | 12.8 | 796 | 10.1 |
Bachelor's degree | 1,672 | 19.1 | 1,390 | 17.7 |
Advanced degree | 1,024 | 11.7 | 703 | 8.9 |
Asian | ||||
Less than a high school diploma | 260 | 6.4 | 260 | 5.6 |
High school graduates, no college | 695 | 17.2 | 764 | 16.5 |
Some college, no degree | 365 | 9 | 456 | 9.9 |
Associate degree | 320 | 7.9 | 274 | 5.9 |
Bachelor's degree | 1,387 | 34.3 | 1,501 | 32.5 |
Advanced degree | 1,013 | 25.1 | 1,371 | 29.6 |
Hispanic | ||||
Less than a high school diploma | 1,957 | 21 | 3,859 | 29.9 |
High school graduates, no college | 2,588 | 27.8 | 4,156 | 32.1 |
Some college, no degree | 1,612 | 17.3 | 1,763 | 13.6 |
Associate degree | 972 | 10.4 | 930 | 7.2 |
Bachelor's degree | 1,449 | 15.6 | 1,532 | 11.9 |
Advanced degree | 730 | 7.8 | 688 | 5.3 |
Includes persons in the civilian noninstitutional population age 25 years and older that are employed or actively looking for work. Estimates for the race groups will not sum to totals because data are not presented for all races. Data do not include persons of two or more races. Hispanics may be of any race. Advanced degree includes people with master's, professional, and doctoral degrees. Source: 2016 annual averages, Current Population Survey, U.S. Bureau of Labor Statistics