
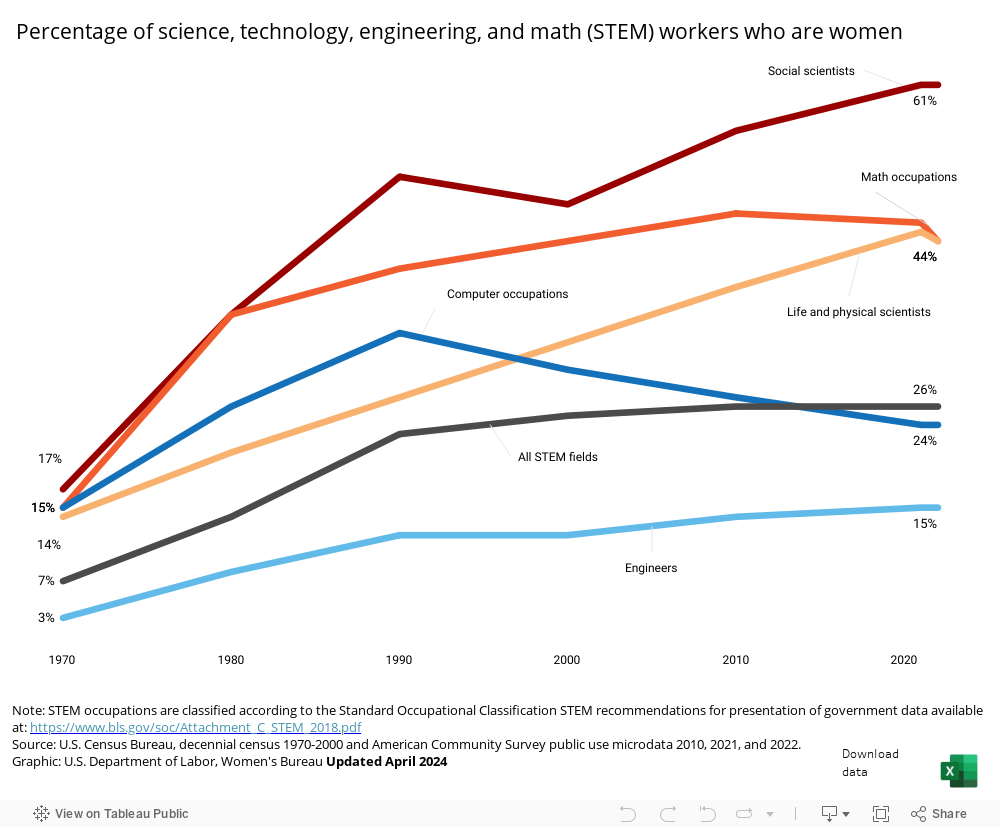
Note: STEM occupations are classified according to the Standard Occupational Classification STEM recommendations for presentation of government data available at: https://www.bls.gov/soc/Attachment_C_STEM_2018.pdf Source: U.S. Census Bureau, decennial census 1970-2000 and American Community Survey public use microdata 2010 and 2019. Graphic by the Women's Bureau, U.S. Department of Labor
| Year | STEM (percent women) | Engineers (percent women) | Computer occupations (percent women) | Mathematics occupations (percent women) | Life and physical scientists (percent women) | Social scientists (percent women) |
|---|---|---|---|---|---|---|
| 1970 | 7 | 3 | 15 | 15 | 14 | 17 |
| 1980 | 14 | 8 | 26 | 36 | 21 | 36 |
| 1990 | 23 | 12 | 34 | 41 | 27 | 51 |
| 2000 | 25 | 12 | 30 | 44 | 33 | 48 |
| 2010 | 26 | 14 | 27 | 47 | 39 | 56 |
| 2019 | 27 | 15 | 26 | 47 | 45 | 61 |