About the Gallery
Explore our data visualizations to discover trends and better understand the impact of our programs.

Learn about trends in defined benefit and contribution plan counts since 1975.
Topics: ERISA, Form 5500, Benefit Plan

Explore the variation in veterans unemployment rates by state over time.
Topics: Veterans, Unemployment Rate, State
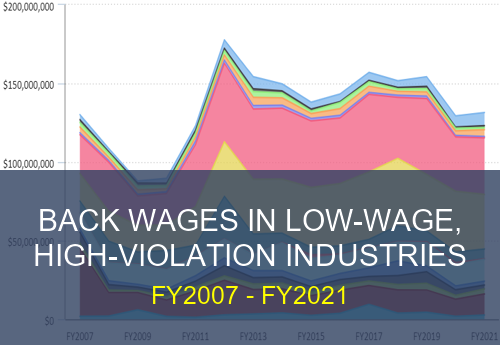
View the evolution of back wages recovered for workers by industry.
Topics: FLSA, Back Wages, Industries, Workers
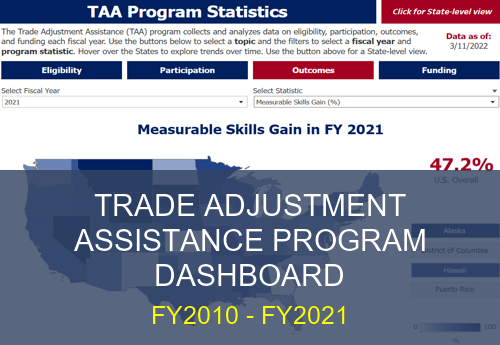
Learn about the eligibility, funding, participation, and outcomes of the TAA program.
Topics: Trade Act, Eligibility, Participants, Outcomes, Funding, Workers, State
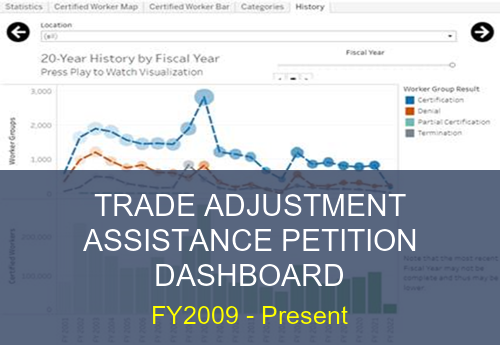
Get information about worker groups that have been certified or denied eligibility.
Topics: Trade Act, Petitions, Determinations, Certifications, Workers
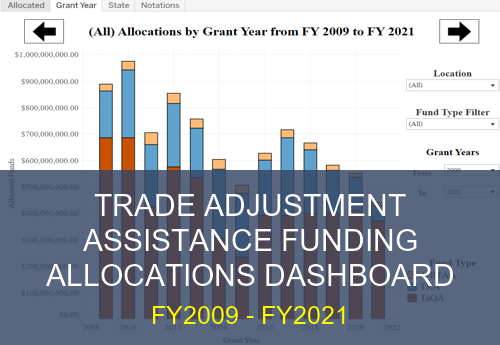
Explore the funding provided to states for the TAA program and its benefits.
Topics: Trade Act, Financial, Grantees, State
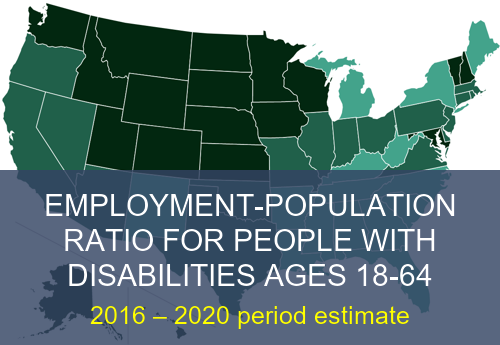
Explore the employment rate for people with disabilities by state and race/ethnicity.
Topics: Disability, Employment-Population Ratio, Workers, State, Race/Ethnicity
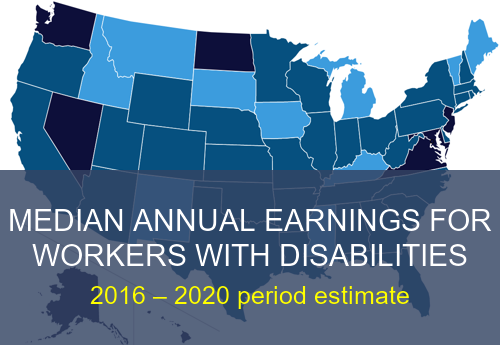
Explore median annual earnings for workers with disabilities by state and sex.
Topics: Disability, Earnings, Workers, State, Sex
